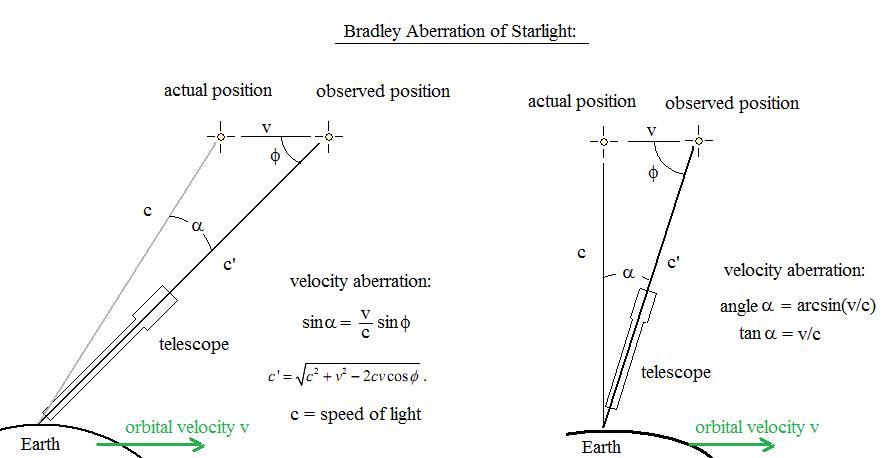       
The Aberration of Light and the Experiment of Ernest Esclangon. Doug Marett (2010) Introduction: The aberration of light is a phenomenon where the observed position of a distant light source is different than its actual position, due to a difference in velocity between the source and the observer. The effect was first discovered by James Bradley in 1727 after he observed that the apparent position of the star g Draconis when viewed directly overhead would change over the course of a year of observation. Bradley was initially looking for evidence of parallax, which would be due to the change in the position of the Earth over the course of the year in relation to the star. However, he realized that the movement he was witnessing was not due to parallax - in fact, it was due to the change in the velocity of the Earth in relation to the star instead. The aberration effect meant that the star appeared to be lower in the sky than one would expect from its actual position. Fig. 1:
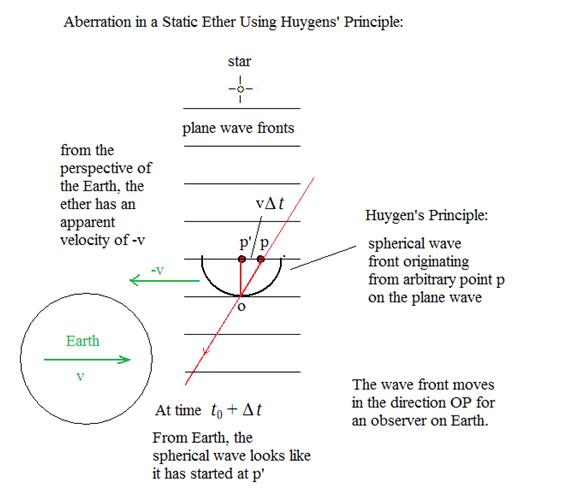
With the advent of the wave theory of light in the 19th century, it was necessary to develop a new understanding of the aberration of light that was consistent with the theory of a medium of space. Lorentz developed an explanation of how light aberration can occur from wave theory assuming an immobile ether, as is described in his textbook (1,2). Lorentz's explanation is based on Huygens' principle. If we consider a plane wave coming from a star overhead: Fig. 2:
In the figure above, a plane wave of parallel horizontal wave fronts in the ether arrives in the vicinity of the Earth from a distant star. The Earth is moving through the ether at velocity v, which is the same as saying that the ether is moving towards a stationary Earth with velocity -v. According to Huygens' principle, any point on the wave front can be considered the origin of a new spherical wave front. Since this new spherical wave is moving towards the Earth both vertically (at the speed of light) and horizontally (at apparent velocity -v), from the perspective of an observer on Earth who sees the spherical wave at time to + Dt, the new spherical wave appears to have originated at p' rather than at p. The separation between p' and p is vDt. Although the plane waves appear to arrive horizontally on Earth, they appear to come from a line through OP rather than OP'. The angle difference between the two of course is the aberration angle.
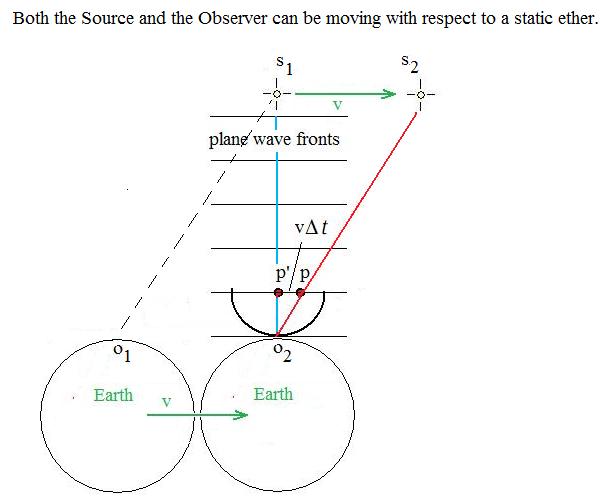
For the ether model to work, the stars do not need to be fixed to the frame of the static ether. As can be seen from the figure below, position O1 corresponds to where the Earth is when the source S1 first emits the light. When the light actually reaches the Earth, Earth is at position O2. However, to the observer on Earth, it looks like the light has come from position S2. If the star at S1 has the same common velocity as the Earth of v, then when the light reaches position O2, the star has really reached position S2, so its position corresponds with the actual direction that the viewer at O2 sees it. Fig. 3:
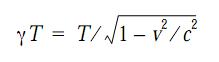
In conclusion, any velocity component that the source and the observer have in common will not result in a shift in the sources apparent position. This above argument also explains why there would be no aberration of light from terrestrial sources to terrestrial observers. Since they have a common velocity, regardless of the relative velocity of an ether frame, the observer will always receive the light from a direction in line with the actual position of the source at the time it is received. In a simple telescope, this would be the same whether the ether frame was a Stokes ether (Earth Centered Earth Fixed (ECEF) frame) or a partially dragged ether (at rest in the Earth Centered Inertial (ECI) frame) or an ether fixed to the Cosmic Microwave Background (CMB). However, a problem arose when it came to explaining the aberration expected in telescopes or light paths with a refractive index other than 1. Arago found that there was no change in the aberration angle when the light from a star was passed through a glass prism. The issue was addressed by Fresnel, would found that the aberration angle would be expected to be different in a glass filled telescope as compared to an empty telescope. The only way to explain the difference was to assume that the refracting material in the telescope changed the speed of the light in the glass by the fraction: f = 1 - 1/n2 where n is the refractive index of the material. This is the Fresnel coefficient of partial ether drag. This coefficient ensures that the refraction of light in a moving body follows Snell's law from the point of view of an observer moving with the body. In 1892 Lorentz wrote an extensive treatise on the electrodynamics of moving bodies, and was able to show that for a wave propagating along the direction of motion of a frame moving with velocity v, must have a velocity c/n - v/ n2 in that frame (to order v/c). Hence, the wave velocity with respect to the ether would be c/n - v/ n2 + v = c/n + v (1-1/ n2) in accordance with the Fresnel coefficient. This new view of Lorentz suggested that it is the waves that are partially dragged and not the ether. The electric field of the wave displaces the electrons in the refractive medium creating a common motion. The moving electrons are then subjected to an additional Lorentz force from the magnetic field of the wave. Both of these effects reduce the velocity of the wave by v/ n2 from the value of c/n when the medium is at rest in the ether (2). Lorentz's exact theorem of corresponding states (Lorentz transformations) uses the equation c/n - v/ n2 + the Lorentz contraction to effectively nullify the effect of any fringe shift in an interferometer experiment - Lorentz completed this theorem to counter Lienard's proposed experiment with an interferometer with an arm with a refractive index greater than 1 (2). Lorentz's exact theorem of corresponding states also explicitly notes (1899) that the frequency of oscillating electrons generating the light waves is lower in systems in motion than in those at rest by:
This idea was also presented by Larmor in more detail in 1900, and is sometimes referred to as Larmor time dilation. The
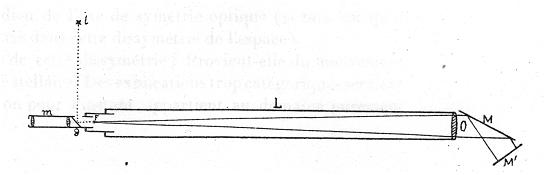
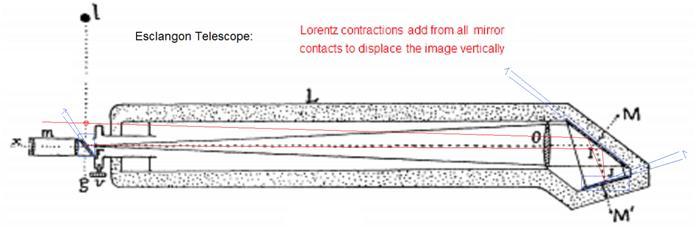
Experiment of Esclangon: Ernest Esclangon performed an autocollimator experiment at the Observatory of Strasbourg in 1927 testing the idea that the angle of reflection of a beam of light might change in different directions due to the effect of an ether wind. The English translation of this paper is available on this website at (3). The autocollimator was in the form shown below in Fig. 4. Fig. 4:
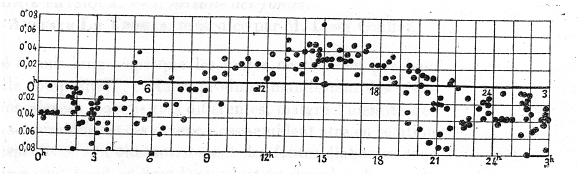
A beam from a light source i is directed to a beam splitter mirror and then passes a wire F down the tube of length L through an objective lens O to a set of reflecting mirrors M and M'. These send the light back down the tube through the beam splitter to the eyepiece. As in most autocollimator apparatus, the viewer measures a change in the angle of a beam of light by a displacement of the reflected image of a reticle with respect to the stationary reference. In this case, Esclangon is comparing the deviation of the wire F with its reflected image. The device used here was sufficiently accurate to measure vertical deviations in the angle of the reflected beam down to fractions of an arc second. Esclangon pointed the device in the NE and NW directions for each set of measurements, and compared the deviations between the two. Measurements were taken 40,000 times over the course of a year at all times of the day and through the different seasons. When these deviations were plotted against the sidereal day, it was found that there was a sidereal pattern of deviation with a period of one sidereal day as shown in Fig. 5. Fig. 5:
How does one explain the result of Esclangon? We see three potential explanations: 1) That the Lorentz transformation is incorrect, so if a medium of space does exist, the relative motion of this medium and the Earth could cause a deflection of a beam of light between a co-moving source and receiver. This would be a first order effect (v/c) and would cause a phase change of one cycle per sidereal day. 2) That a Lorentz contraction of the autocollimator mirrors is occurring and is the cause of the effect - in this case it would be a second order effect (v2/c2) and would have a period of 2 cycles per sidereal day. 3) That there is some other real unknown effect, which would also include artifacts. Autocollimator
Experiment to Test the Lorentz Transformation: Presence
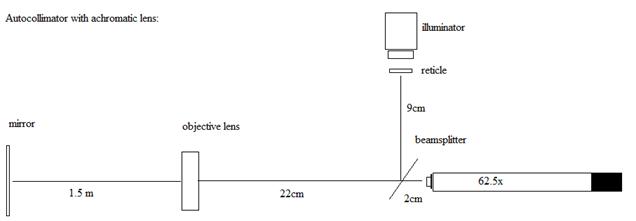
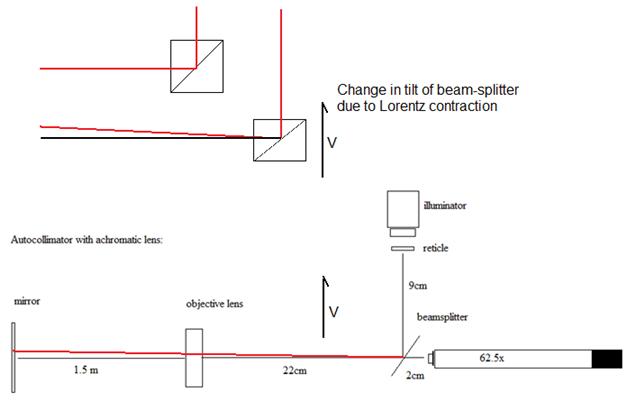
or absence of Terrestrial Aberration The purpose of the experiment outlined below was to determine if the velocity of rotation of the Earth can be detected by measuring the horizontal displacement angle of an image projected to a distant mirror and back, as viewed through a microscope objective. The possible outcomes are: 1) A small angle can be detected, that would amount to proving that terrestrial diurnal aberration exists. If the motion of the Earth in rotation can be detected, then from the N-S orientation to the S-N orientation, the image should be displaced by ~7um for an image path of 3.6 meters (forward + return). This would suggest that the Lorentz transformation is violated. 2) the Lorentz transformation used by relativity and Lorentz ether theory correctly predicts the apparent change in angle of light by the amount to compensate for the motion, in which case no change in beam angle is visible, and thereby no aberration occurs. An autocollimator was constructed that is capable of detecting displacements of a light beam by less than 1 part per million. For a beam path of 3.6 meters long, the resolution of the instrument was determined to be 0.7um (~1 part in 2E-7). A diagram of the autocollimator is shown below (top view): Fig. 6:
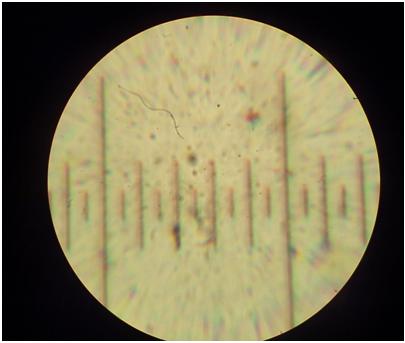
The autocollimator projects an image of a reticle onto a CCD camera placed at the eyepiece of the viewing lens at the far right of the diagram. A picture of this reticle from the CCD camera is shown below in Fig. 7. The small divisions are 50um. By expanding the image on a computer and measuring the image displacement in pixels, it is possible to measure to 0.7um. In this experiment, there were 1.6 pixels per um in the images, and this gave a minimum resolution of 0.625 um per raw image. Fig.7:
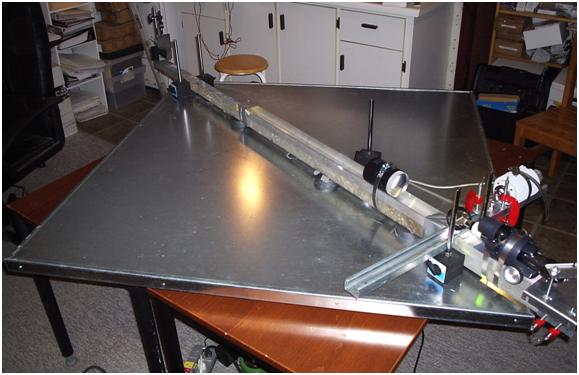
Below is a picture of the completed autocollimator on its rotating bench. This allows the device to be pointed in the various cardinal directions for each set of measurements. Since the rotation of the Earth is from west to east, a hypothetical ether wind due to the Earth's rotation would have the opposite velocity if the Earth was considered stationary and the ether was moving. The ether velocity is thereby from east to west. If the autocollimator is zeroed when pointed North, then the deflection of the image by the ether wind when the autocollimator is rotated to pointing south would be expected to be west from its zero position. Figure 8 shows the autocollimator pointing in the south direction. Fig. 8:
The rank and pinion control from a 3 inch refractor was used to control the eyepiece and microscope objective focus. The eyepiece is 25x and the microscope objective is 2.5X (62.5x total). A microscope lamp was mounted on a 90 degree arm, along with the reticle, which is on a slider to allow its position to be adjusted. A telescope achromatic lens is also on a slider to control focus on the reticle. The camera is on a mount platform on the far right to allow it to capture the eyepiece image. The position of the reticle with respect to the CCD frame is photographed in the North pointing position, and then in the south pointing position, by a rotation of the entire table. The CCD images are then uploaded to a computer and the CCD frames are precisely aligned. The deviation of the reticle in the frame from the N to S photograph is then determined in pixels. A similar rotation of the autocollimator from east to west was also performed and photos taken as a control. Results: First experimental run: 330PM. Path length from mirror to eyepiece is 185cm. From mirror to beam splitter is 160cm. Values are pixel positions left/ right for identical positions in the photographs: 3:30PM
S1 is shifted west from N1 by 4.33 pixels on average (1um = 1.6 pixels) = 2.7um west
W1 is shifted left from E1 by 2.67 pixels on average (1um=1.61 pixels) = 1.66um south. Values are pixel positions left/ right for identical positions in the photographs:
S2 is shifted east from N2 by 4.67 pixels on average (1um = 1.6 pixels) = 2.9um east
W2 is shifted right from E2 by 10.3 pixels on average (1um=1.6 pixels) = 6.4um north. 9:30PM
S1 is shifted East from N1 by 2.0 pixels on average (1um = 1.6 pixels) = 1.25 um East
W1 is shifted right from E1 by 1.5 pixels on average (1um=1.61 pixels) = 0.94 um north.
S2 is shifted West from N2 by 3.8 pixels on average (1um = 1.6 pixels) = 2.4 um West
W2 is shifted left from E2 by 1.33 pixels on average (1um=1.61 pixels) = 0.83 um south.
S4 is shifted West from N4 by 4.33 pixels on average (1um = 1.6 pixels) = 2.7 um West
W4 is shifted right from E4 by 3.33 pixels on average (1um=1.61 pixels) = 2.1 um north. The average of the first 5 determinations are: When facing South, the image is deflected West by no more than 0.73um on average. When facing West, the image is deflected North by no more than 1.17um on average. The expected result was 6.9um West. 11:45AM Dec 15
S1 is shifted West from N1 by 1.5 pixels on average (1um = 1.6 pixels) = 0.94 um West S1 shifted 18 pixels down
W1 is shifted left from E1 by 5.8 pixels on average (1um=1.6 pixels) = 3.65 um south. W1 is shifted vertical up 23 pixels
S2 is shifted East from N2 by 5.3 pixels on average (1um = 1.6 pixels) = 3.33 um East S2 shifted up by 4 pixels
W2 is shifted right from E2 by 6.5 pixels on average (1um=1.6 pixels) = 4.06 um north. W2 shifted up by 8 pixels
S3 is shifted East from N3 by 4.7 pixels on average (1um = 1.6 pixels) = 2.92 um East S3 shifted up by 5 pixels
W3 is shifted right from E3 by 13.2 pixels on average (1um=1.6 pixels) = 8.3 um north 1:30PM Dec 15
S1 is shifted East from N1 by 2.8 pixels on average (1um = 1.6 pixels) = 1.77 um East S1 is shifted down by 10 pixels
W1 is shifted right from E1 by 6.5 pixels on average (1um=1.61 pixels) = 4.06 um north. W1 is shifted down 9 pixels.
S2 is shifted East from N2 by 4.2 pixels on average (1um = 1.6 pixels) = 2.6 um East S2 is shifted vertically up by 6 pixels
W2 is shifted right from E2 by 2.5 pixels on average (1um=1.61 pixels) = 1.56 um north. W2 is shifted vertically down by 5 pixels. The average of the next 5 determinations are: When facing South (11:45AM), the image is deflected East by no more than 1.76 um on avg. n=3 When facing South, (1:30PM)the image is deflected East by no more than 2.19 um on avg. n=2 When facing West (11:45AM), the image is deflected North by no more than 3.72um on avg. n=3 When facing West (1:30PM), the image is deflected North by no more than 2.81um on avg. n=2 Total of 10 determinations: South facing = 0.6um East West facing = 2.263 um North The expected result for south facing = 6.9um West. 6PM Dec 16
S1 is shifted East from N1 by 0.16 pixels on average (1um = 1.6 pixels) = 0.1 um East (but S2 is shifted vertically up by 20 pixels = 12.5um)
W1 is shifted left from E1 by 3.83 pixels on average (1um=1.6 pixels) = 2.4 um south. (but W1 is shifted vertically up by 22 pixels = 13.8um)
S2 is shifted East from N2 by 4 pixels on average (1um = 1.6 pixels) = 2.5 um East (but S2 is shifted vertically down by 46.5 pixels = 29um)
W2 is shifted right from E2 by 7 pixels on average (1um=1.6 pixels) = 4.4 um north. W2 is shifted down 5 pixels
S3 is shifted west from N3 by 8.5 pixels on average (1um = 1.6 pixels) = 5.3 um west S3 is shifted down 14 pixels
W3 is shifted right from E3 by 2.67 pixels on average (1um=1.6 pixels) = 1.67 um north W3 shifted down by 41 pixels Dec. 17, 2009 530PM Dec17
W2 is shifted left from E3 by 2.25 pixels on average (1um=1.5 pixels) = 1.5 um south 7PM Dec17
W3 is shifted left from E3 by 5 pixels on average (1um=1.5 pixels) = 3.3 um south 7PM Dec17
W4 is shifted right from E4 by 3.75 pixels on average (1um=1.5 pixels) = 2.5 um north For the 13 readings over two days: The average deviation of the image from the N-S line was 0.25um East (n=13). Expected was 6.9um west. The average deviation from the E-W line was 1.92 um north (expected zero).
Summary of the Experimental Results: The N-S data showed a shift E on average of no more than 0.25 um (n=13) Standard deviation = +/-2.8um. Since the expected result was 6.9um west, then the idea of measuring terrestrial diurnal aberration is shown to be not possible. The E-W data showed a deviation N of not more than 1.42um on average (n=16), standard deviation = +/- 3.5um. This result was expected to be zero. Since it is within the error margin, this tiny deviation is likely from the movement of the beam splitter or camera shutter ( measured at about +/- 1.1 um). Discussion: Absence
of first order Terrestrial Aberration: In this experiment we were looking for evidence of a shift of the image angle to the west due to the movement of the autocollimator with the Earth's rotation at ~300 m/s at our latitude. This was when the autocollimator axis was perpendicular to the movement of the Earth (pointing N and then rotated S). We found that the average deviation was 0.25um out of the expected 6.9um; this means that the deviation is less than what would be expected if the Earth was rotating at -12.2 m/s (i.e. -3.6% of the expected value). This suggests that within the experimental error of the experiment, the Lorentz transformation holds and there is no visible terrestrial aberration due to the rotation of the Earth. If the Lorentz transformation holds, then we would not expect an autocollimator experiment to be capable of detecting an even larger aberration effect due to the motion of the Earth with respect to the Cosmic Microwave Background, since according to Lorentz's theory, if the source and the receiver are co-moving (as they are with the autocollimator), then it does not matter if a hypothetical ether is moving between them in any direction, the theorem of corresponding states leads to the conclusion that an aberration of light will only occur if there is a difference of velocity between the source and the receiver, and not a difference in velocity between either source or receiver and the ether. Second
Order Lorentz Contraction of the Mirrors: It is mentioned by Herbert Ives in his paper "Graphical Exposition of the Michelson-Morley Experiment". p. 178 (4) that in a Michelson interferometer the Lorentz contraction is necessary in the beam splitter for the light beam to return from the mirror at the correct angle. In the Ives paper, the beam splitter can be envisioned as a diagonal line through the body of a square that is contracted. The contraction changes the angle of the diagonal since the length becomes shorter than the height, as a consequence, the angle is changes from 45 degrees to some angle less than 45 degrees. An example of this is shown below in Fig. 9. Fig. 9:
This change in angle of the beam splitter in the autocollimator configuration due to a possible Lorentz contraction when the beam splitter and illuminator are horizontally disposed as in our setup does partially compensate for any aberration angle in the autocollimator, since the image would be deflected slightly. However the deflection expected due to the transverse ether drift is first order - equal to 0.206 arc seconds at 300 m/s of ether drift due to the Earth's rotation. The mirror deflection change due to the Lorentz contraction is second order and is 0.206 E- 6 arc seconds. Thus the Lorentz contraction effect is miniscule (1 part per million) as compared to any aberration effect. If we examine the construction of the Esclangon telescope, the mirrors tilt in a manner that increases the vertical displacement of the image if they would be subjected to a Lorentz contraction - the telescope is a Lorentz contraction detector of sorts, although the amount of this effect is very small. Since the effect is second order, a very large ether wind would be required to generate a visible image displacement. A physical Lorentz contraction is anticipated in Lorentz ether theory but not in Einstein's relativity. If we speculate for a moment on whether this might be a potential cause of the image deflection seen in Esclangon's experiment, how might this occur? Fig. 10:
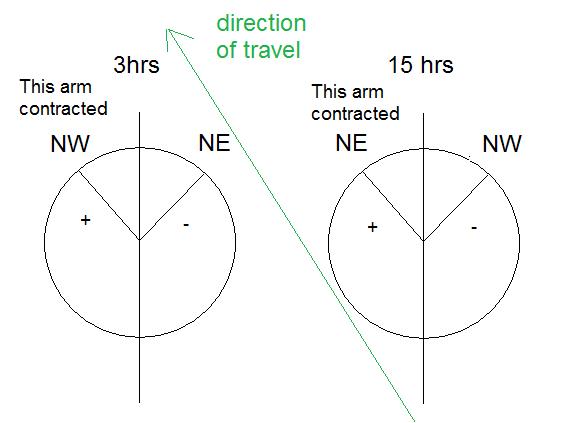
The Esclangon system is ideal in its susceptibility to such an effect since all the mirrors are vertically disposed - which means that when turned perpendicular to a hypothetical ether wind, the Lorentz contraction has no effect on their angle tilt, but when turned parallel, they all twist to become more vertical (since they are contracted in their horizontal direction). An analysis of the Esclangon's telescope using an Excel spreadsheet demonstrates that if the telescope experienced a hypothetical ether wind of 112 km/s vs. zero in the 90 degree directional shift as performed in Esclangon's original experiment, then this would result in a vertical displacement of the beam by 0.036 arc seconds due to a Lorentz contraction of the mirrors alone. The difference around the sidereal day in the original paper was on average +/- 0.036 arc seconds, measured at 3 hrs and 15 hr, respectively (see Fig.5). This might be explained as due to a Lorentz contraction as follows. We recall that in Esclangon's experiment, the telescope was pointed in the NW direction and the image was centered, and then the displacement of the image was measured after rotating the telescope to the NE direction. This method of measurement was used throughout. If we now refer to figure 11: Fig.11:
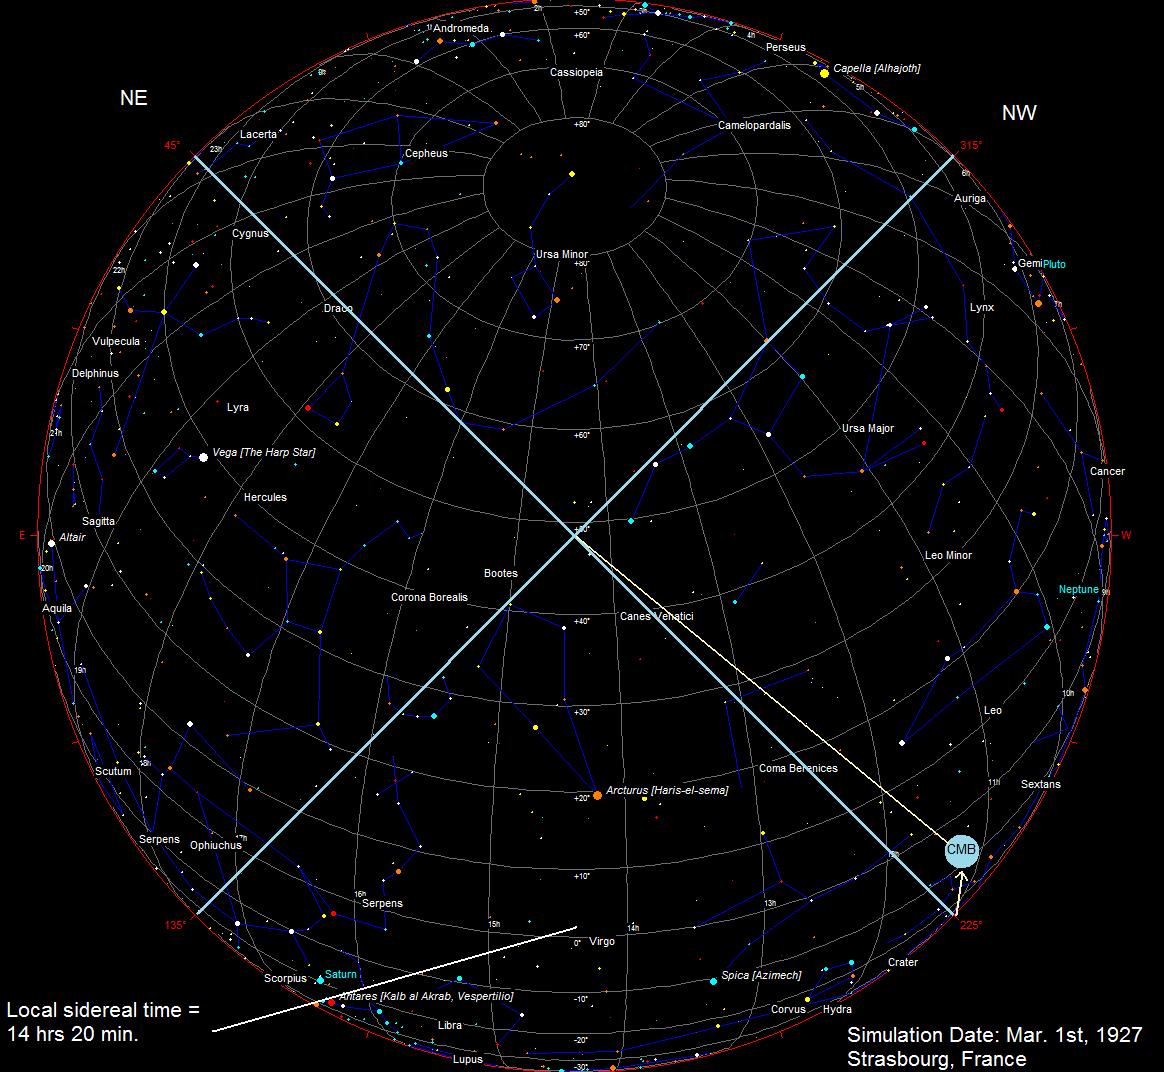
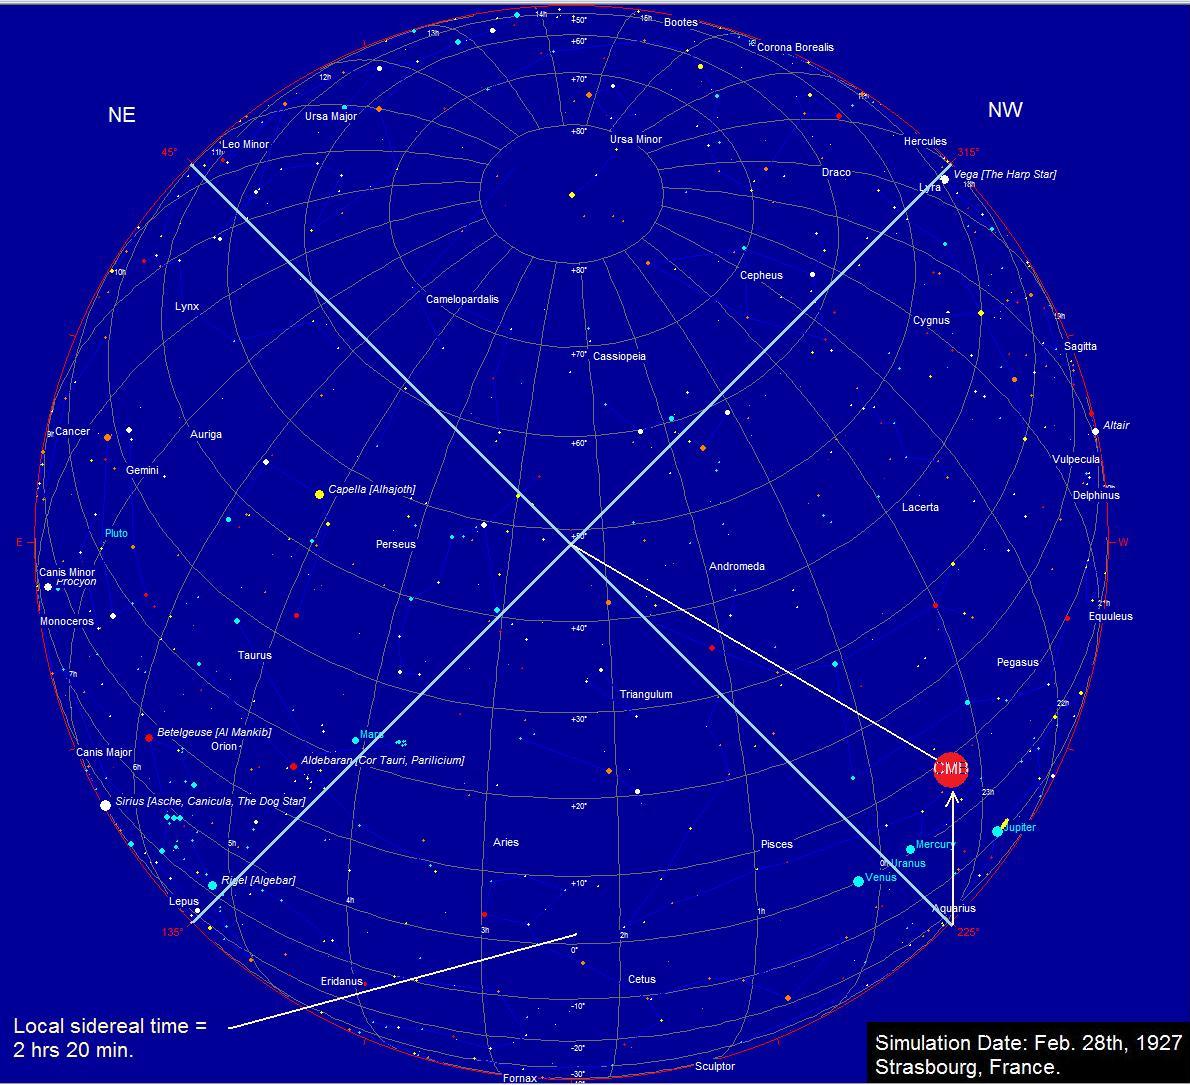
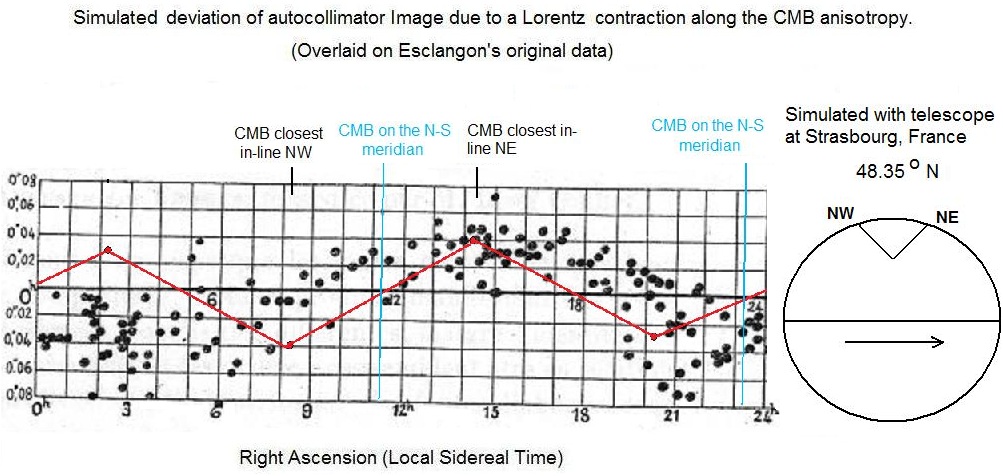
When the telescope is at 3 hrs, we presume that the NW direction is best aligned with the ether wind direction of travel. Since the telescope is zeroed to this condition, then when it is swung to the NE direction, it is now more or less perpendicular to the ether wind. The mirrors then expand and this causes a negative deflection of the beam by 0.036 arc seconds. Conversely, at 15 hrs, when the Earth has rotated 180 degrees from its previous orientation with respect to the fixed stars, the NW direction of the telescope is now perpendicular to the ether wind, and since the telescope is zeroed in this position, when it is rotated to the NE position, the mirrors contract and now the image is deflected up by 0.036 arc seconds. This simulation gives a one cycle per sidereal day image deviation due to a possible Lorentz contraction of the mirrors, but only if the telecope is one the equator of the Earth. The expected result under these conditions, overlaid on Esclangon's data, is shown below in Fig.12. Fig. 12: 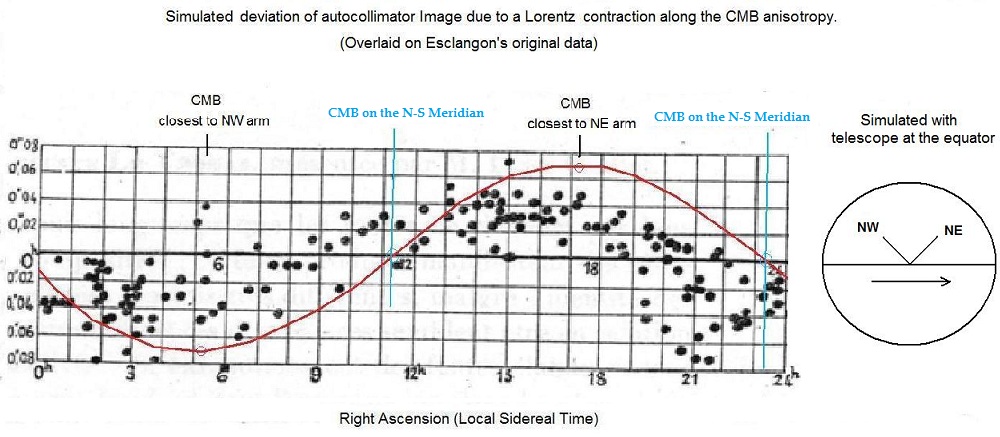 Since the experiment was actually performed at a much higher latitude, in Strasbourg, France (Lat. 48.35 degrees North), the telescope is much further up the sphere of the Earth, and this will tend to return the pattern of image deviation to closer to two cycles per sidereal day. This is because the NE and NW orientations of the telescope each have an opportunity to partially line up with the line of the CMB anisotropy once every 12 hours, since a Lorentz contraction can occur in either direction along this line. This was simulated using Starcalc. Click on the images below (Fig. 14 - 17) to view the orientation of the telescope with respect to the CMB dipole:
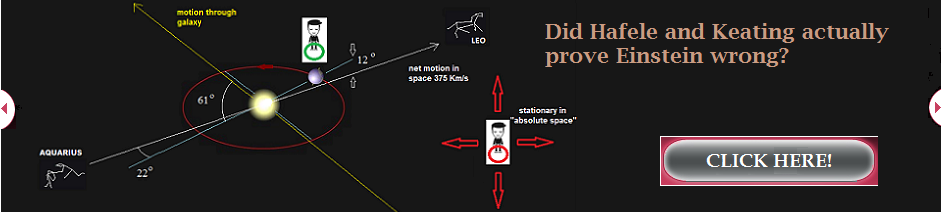
It is because of the particular way that the experiment is performed that the period of change that might be expected due to a real Lorentz contraction could be either one cycle per sidereal day, or two cycles per sidereal day, depending on the latitude of the experiment. Since Esclangon's telescope is fixed to these two cardinal directions, it can't sweep through any others and thus one would expect that if there is some anisotropy in space, Esclangon's telescope only samples a fraction of this, which depends on the closest angle the telescope can make to the anisotropy given these conditions. If what Esclangon was detecting was the abolute motion of the Earth with respect to the Cosmic Microwave Background (CMB) radiation, the anisotropy of this radiation lies in a line passing through Right Ascension 11.2, Declination -7 near the constellation of Leo (most up to date values). The other end of the dipole passes near the constellation of Aquarius. The closest any one arm can get to this dipole line is around 18 degrees, so the maximum anisotropy one would expect would be less than 365 km/s. The maximum vertical deflection would be expected around 14.2 sidereal hours and the minimum around 8.2 hrs. Fig. 13 shows what the expected pattern of image deviation would be (red line) based on the location of the CMB, superimposed on Esclangon's data graph and now corrected for the actual latitude of the experiment at 48.35 degrees N in Strasbourg, France. Fig.13:
The period of the pattern is now 2 cycles per day, with a maximum cycle (trough/peak at 8 and 14 hrs sidereal time) and a minimum cycle (trough/peak at 20 hrs and 2 hrs). If we use our Esclangon Telescope Simulator we find that at the maximum deflection of the image that was observed in the experiment, around 0.08 arc seconds, would correspond to a hypothetical ether wind of 170 km/s. This is a partial match - the ether wind is smaller than expected, and it matches in phase for a good part of the graph but the 2 hr sidereal peak is missing. We need to point out though that other experiments and observations, in particular GPS range times, would tend to suggest that the CMB anisotropy is not detectable as an ether wind, since such a wind would cause huge differences in the propagation times of the one way signals between satellite clocks and Earth clocks. So it would be premature to jump to the conclusion that Esclangon actually detected a CMB-based rest frame for light. The experiment stands as a fascinating mystery, the implications of which are still not fully understood. References:
1) Lorentz, Hendrik, Lectures on Theoretical Physics. 2) Janssen, Michel, Stachel, John, The Optics and Electrodynamics of Moving Bodies. 2004. 3) Esclangon, Ernest, "On the Optical Dissymmetry of Space and the Laws of Reflection." Comptes Rendus hebdomadaires des séances de L'Académie 1927 (T185) p.1593-1594. 4) Ives, Herbert, "Graphical Exposition of the Michelson-Morley Experiment". JOSA 1937 Vol. 27, No. 5, p. 177-180. 5) Muller, Richard, "The Cosmic Background Radiation and the New Aether Drift." |