         A Replication of the Silvertooth Experiment. .pdf
version here Doug
Marett
(2012) Abstract
Described
herein is a replication of Silvertooth’s experiment of 1986/1992. The
analysis
starts by re-performing the wavelength difference method described in
these two
papers and examining the distance required to move a standing wave
sensor
(SWD)/mirror system on a translation stage to register a phase
inversion. After
performing this procedure repeatedly over a number of sessions between
June and
December 2011, a similar 12 hour pattern of change was seen conforming
to the
original observation of Silvertooth. The experiment is then repeated
using a
new method involving measuring the frequency generated at the two
sensors using
an oscillating stage driven by piezo actuation. Finally, experiments
are
performed to try to determine the true cause of the diurnal pattern of
presumptive wavelength change, focusing on the HeNe laser and its beam
pointing
stability over time. The final conclusion is that the wavelength of
light
measured in the system is not changing in a manner dependent on
sidereal
direction. The cause of this diurnal pattern turns out to be something
far more
mundane. Introduction:
With the discovery of the
cosmic microwave
background radiation (CMBr) in the late 1970’s, and its implication as
a potential
rest frame for the universe, there began a renewed interest in aether
drift
experiments. This was in part prompted by the title of Muller’s article
on the
U-2 experiments published in Scientific American (1978) “The Cosmic
Background Radiation and
the New Aether Drift.”[1]
One of the more compelling and arguably unresolved pieces of evidence
in favour
of a detectable aether drift from this period was the Silvertooth
Experiment. E. W
Silvertooth was one of the pioneers of
the standing wave interferometer which he first described in the
Journal of
Applied Optics in 1983. [2] Three years later he used this technology
to
perform a novel interferometer experiment attempting to detect our
motion
through space, a modern aether drift experiment of sorts. Silvertooth’s
argument was that although it is impossible to measure the one way
speed of
light, it should be possible to measure the one-way wavelength of
light. His
strategy was to create a standing wave between a laser and a distant
mirror,
and then to move a transparent standing wave detector along the axis of
this
beam, monitoring the phase of the standing wave encountered by the
sensor on an
oscilloscope. A mirror moving with the sensor on a common platform
would also
move a second beam towards a photodiode forming part of a Michelson
interferometer. The idea was that the standing wave sensor would detect
the one
way wavelength along the path, while the photodetector in the Michelson
interferometer would detect the average 2-way wavelength. If this were
true,
then as the speed of light changed depending on the direction the laser
beam
pointed in space, the wavelength through the standing wave detector
(SWD) would
vary to longer or shorter than the reference wavelength, thereby
informing us
on our ultimate direction and velocity of motion. Silvertooth’s first
paper
entitled “Experimental
Detection of the Ether” (1986) claimed
to have detected the
sought wavelength change. [3] He reported measuring our velocity of
motion as
being 378 km/s towards the constellation Leo, almost exactly that
predicted for
the CMBr as a rest frame for light. The claim was made again in 1989
when
Silvertooth published a description of his device in Electronics and
Wireless
World Magazine [4]. Finally, in 1992, Silvertooth co-authored a paper
with
Cynthia Whitney called “A New Michelson-Morley Experiment” where the
same
effect was reproduced using a somewhat simplified optical
arrangement.[5]
Surprisingly, no data graphs were provided in any of the three papers
demonstrating the effect – there was simply a verbal description. This
was
remarkably brief, as follows: “The axis
of the photodetector making the linear scan through the standing wave
was directed
towards the constellation Leo when
the maximum value of v was registered. Six hours before and after the
event the
displacement of the detector revealed no phase changes, meaning that
the
photodetector was being displaced perpendicular to its motion relative
to the
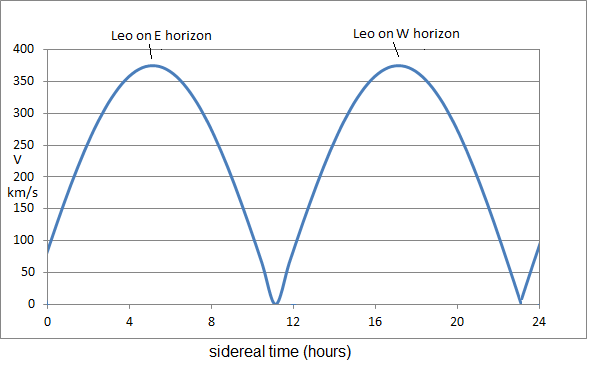
ether.”[4] Essentially
then, one can describe the “Silvertooth effect”
as being a detectable change in the wavelength of a laser beam in an
optical
apparatus fixed to the earth that is rotating with respect to sidereal
space
due to earths diurnal motion. The pattern of change is a 12 hour
period, where
there is a peak displacement when Leo is on the eastern or western
horizon
(since the beam is horizontal) and a minimum or null displacement 6
hours
before or after this. An estimation of what this should look like is
shown
below in Fig.1: Fig.
1: The
“Silvertooth effect”.
Numerous papers
have been published for or against Silvertooth’s
experimental conclusions, however, the rarity of Silvertooth’s standing
wave
sensor made it nearly impossible for anyone to attempt to reproduce the
experiment in the same manner that he did. However, in early 2011 I was
able to
procure a thin film standing wave sensor from the Jülich Research
Centre that
eventually made replication of Silvertooth’s experiment possible. The
following
is a detailed description of what I discovered over the course of 18
months of
investigation. Initial
setups:
The initial optical
setups strove to reproduce the essence of Silvertooth’s experiment
while
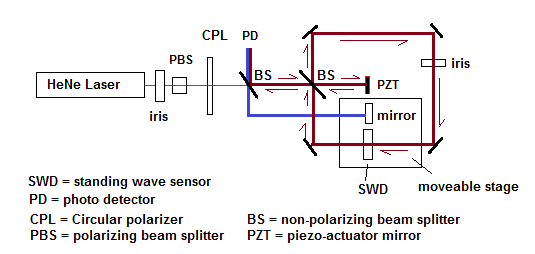
simplifying the optical arrangements where-ever possible. The first
arrangement
attempted resembled the apparatus described in the 1992 paper, except
with the figure
8 path change to simply a square, since the outcome of that 1992 paper
was that
the Sagnac effect was irrelevant to the experimental result. Fig.
2A: Diagram
of the
first optical arrangement based on the 1992 experiment
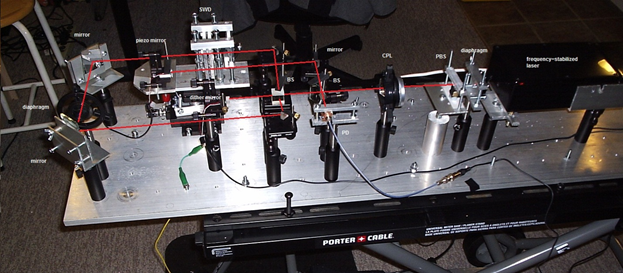
Fig.
2B:
Photograph of
the first optical arrangement.
It’s known from
the 1989 paper that a HeNe laser was used for
the experiment, so I did the same – in our case our laser was equipped
with
frequency stabilization. I also used a circular polarizer to attempt to
prevent
retro-reflections from re-entering the laser tube. Similar to
Silvertooth’s
method, one mirror (labelled PZT) on the moving stage was actuated
using a
triangle wave signal generator to generate a moving standing wave
through the
SWD. By carefully adjusting the amplitude of the drive signal, it was
possible
to create the required AC output signal at the same frequency as the
drive
signal. This was also accomplished with the signal output from the PD
output of
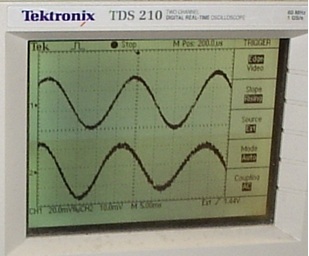
the Michelson interferometer. The two signals, SWD and PD were then
displayed
one above the other on a 2 channel digital oscilloscope. These two
signals are
shown in Fig. 3 below. These resemble figure 3a from the 1992 paper. Fig
3: SWD and
PD
signals displayed for referencing phase shifts between them.
It was noted
early on that the arrangement 1 was far more
complicated than necessary – a simpler optical arrangement was created
which
preserved all the essential elements i.e. PZT control, moveable stage
with both
the SWD and the mirror on it, and the PD detector with Michelson
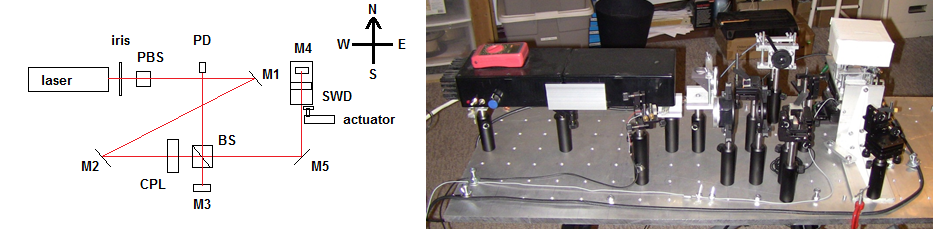
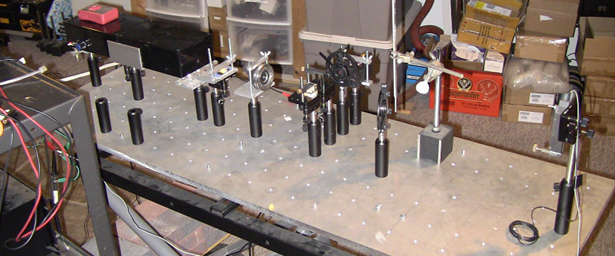
interferometer. This is shown below in Fig. 4. Figure
4: A
second more
simplified optical arrangement
Again, the PZT
was controlled by a triangle wave
generator. PZT1 was used to align
the SWD sensor first, and then PZT2 was used alone to generate the
fringes at both sensors. The
outputs from each sensor
often required amplification – this was performed using parametric
filters
adjusted to the triangle wave frequency to reduce noise, prior to
display on
the scope. Although
initially the stage
was moved by hand using a micrometer and the distance read off the
handle
markers, in subsequent experiments this micrometer head was fitted to a
geared
motor drive to allow the stage to be moved without touching it directly
by
hand. This served to reduce vibrations and spurious phase shifts. This
arrangement is shown in Fig. 5. The entire optical breadboard was
mounted on a
rigid stand which was further weighed down with bricks to reduce
transmission
of vibrations from the floor. Fig.
5: The
second
optical arrangement.
First
series of
data collections
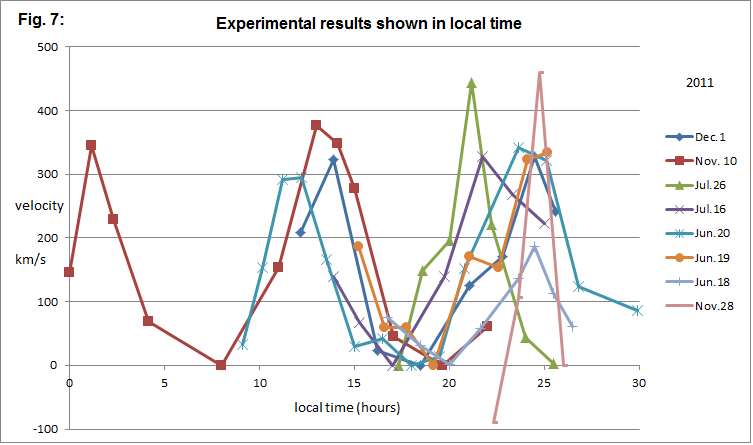
using Silvertooth’s method: A series of data collection sessions were started, beginning in June, 2011, and continued until early Dec. 2011. Each session was typically around 11 – 13 hours, although in one case it was almost 24 hours. The optical table was oriented such that the laser beam was horizontal and pointing due east. This orientation was selected so that the beam would be directed at the constellation Leo once every sidereal day when Leo crossed the Eastern horizon, and would be in line but anti-parallel once every sidereal day when Leo crossed the western horizon. The laser was started at the beginning of each session, allowed at least 45 minutes to warm up, then the frequency was locked using temperature stabilization. The PZT was turned on to generate the oscillating signals at the SWD and PD sensors, and the stage was moved using the motor drive until the two signals were either in phase or out of phase. The micrometer reading was noted, then the stage was moved again until the two signals had shifted 180 degrees of phase with respect to their starting phase at the first micrometer reading. The distance travelled by the stage was then noted. This process was repeated every 1-3 hours during the course of a given session. The distance (D) in meters was then applied into the following equation to determine the predicted difference in the velocity of light from C for a given reading: V = C x After completing a given session, if the lowest value was not zero, then the velocity was normalized across the data to place the bottom of each curve as close to zero as possible to allow the variable potions of different sessions to be compared to each other. Typically all curves had to have at least some correction to zero, so from this standpoint the original observation of Silvertooth that at some point in the observations the difference in wavelength between SWD and PD was vanishingly small (the displacement becomes “unmeasurably large”[5]) was not confirmed. However, if we assume temporarily that some fixed instrumental error in beam alignment may be preventing this from happening we can proceed on this basis to examine the session data, which is presented in Fig 6 in sidereal time and in Fig. 7 in local time. This data was predominantly derived from the second optical arrangement of Fig. 5. It can be seen from both figures 6 and 7 that a 12 hour pattern is visible and reminiscent of the projected appearance of the “Silvertooth effect” drawn in Fig. 1. Interesting, the minimum of Fig. 6 converges around 11AM sidereal time when Leo is perpendicular to the beam direction, and peaks occur 5 hours and 17 hours sidereal time when Leo is on the E or W horizon respectively. However, the persistence of a pattern in local time may also mean that this pattern is due to some local phenomenon.
Data
collection
using
the F1-F2 method:
It had been the
assumption of Silvertooth that the wavelength of light should become
shorter
when the laser is pointing towards Leo (or direction of motion) and
should
become longer when we are pointing in the opposite direction, towards
Aquarius.
This is because of C=fl
and
the assumptions on the relationship between the speed of light and its
wavelength when C is constant only in the preferred frame of the CMBr.
Assuming
Silvertooth’s method above may actually be detecting this wavelength
change, it
is still not capable of discerning the direction, since with his method
we can
only detect the relative change is the apparent wavelength between the
two
detectors, but can’t distinguish which one has the shorter or longer
wavelength. After considering this problem I decided that the solution
would be
to visualize each of the wave-trains passing through the SWD and PD
detectors
over some significant portion of the movement of the stage, such that
the
actual wavelength measured at each detector could be measured. This
would then
allow the determination of which is the shorter and which is the
longer. In
order to do this, it was decided to use an amplified piezo actuator to
repeatedly move the stage back and forth along the optical path by some
fixed
distance, and then to capture the wave-trains generated at the two
sensors
simultaneously in a digital storage scope. These wave-trains could then
be
examined and the phase differences over the course of the actuation
measured to
determine both the magnitude of the phase change as well as determining
which
one was longer and which shorter. Since this method essentially
generates two
“frequencies”, I chose by convention to call the frequency at the SWD
detector
“F1” and that at the PD detector “F2”. The optical arrangement 2 was
thus
modified to incorporate this amplified piezo actuator, which was driven
by its
own H.V. signal generator. In this set of experiments the
piezo-controlled
mirrors did not need to be actuated since the rapid movement of the
stage
itself was sufficient to generate the AC signals at the two sensors.
The
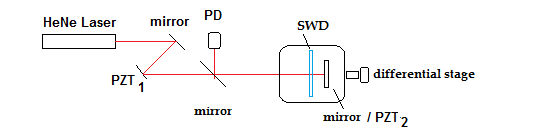
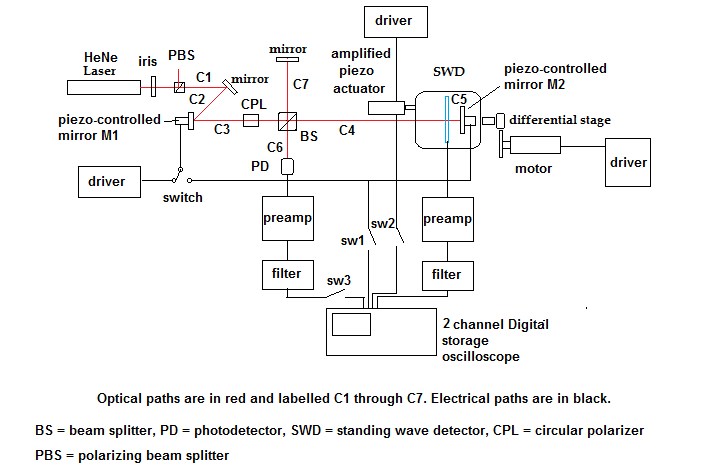
schematic diagram of this setup is shown in Fig. 8 below. Fig.
8: Block
diagram
of the F1 –F2 apparatus.
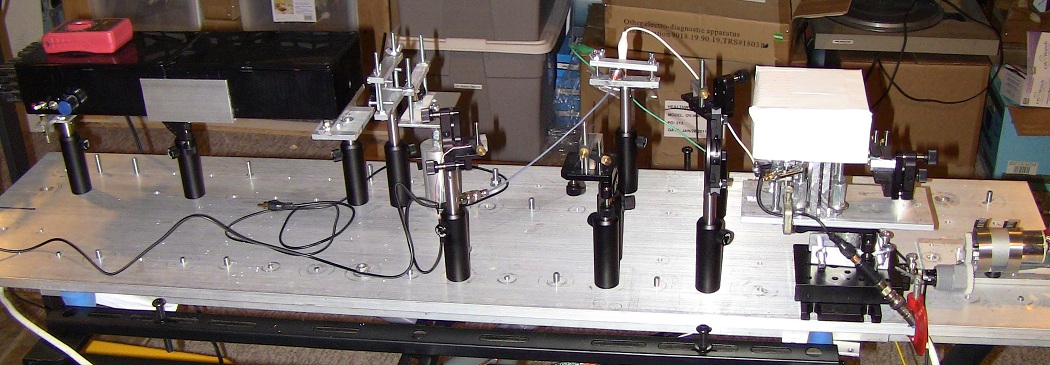
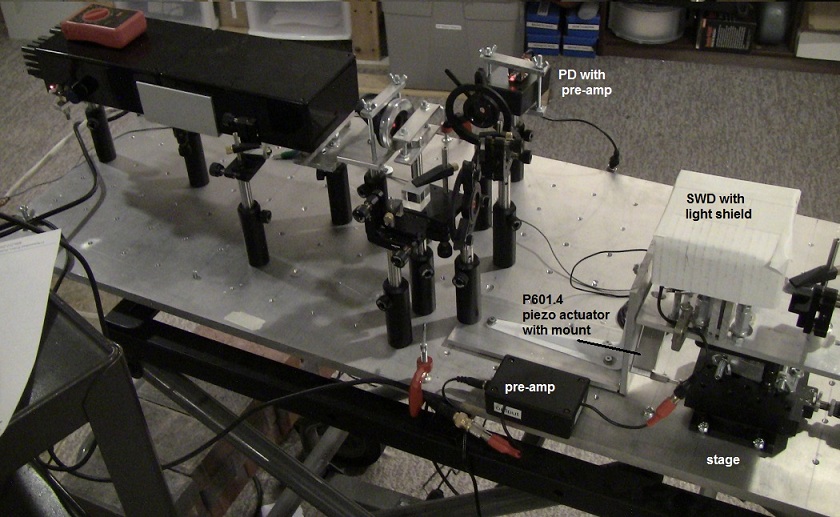
Fig.
9: The optical
arrangement showing the placement of the amplified piezo actuator
For the signal
driver I used a 0.5 Hz ramp signal from a PWM
circuit being driven by a PIC16F777 processor. This provided the
sufficiently
slow oscillation rate. This in turn was amplified to between 30-140V
using a
piezo driver circuit based around the PA78 operational amplifier which
served
to drive a Pi P601.4 amplified piezo actuator with a total range of
400um.
Generally the drive voltage was selected to generate between 50-200
waveforms
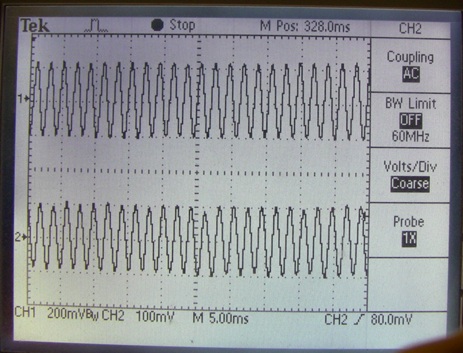
per stroke of the actuator. An example of wave-trains from SWD and PD
sensors
to be subjected to wavelength analysis is shown below in Fig. 10 – the
F1
signal is on top, the F2 signal on the bottom. Fig.
10: Example
of F1
and F2 wave-trains captured from the SWD and PD sensors
As in the first
setup, the apparatus was aligned such that
the laser beam is directed through the SWD sensor along a line that is
horizontal and passes through the cardinal east direction. Data was
collected
in the following manner – as before, the laser would be started and
allowed to
stabilize, followed by applying the stabilization lock. The actuator
would then
be started and the waveforms would be captured by freezing the frame on
the
digital storage oscilloscope. This frame would then be expanded and
photographed at intervals along the entire length of the captured wave
train.
The progressive phase shift between F1 and F2 from the start to the end
of the
wave-trains would then be measured, and this value was then converted
to the appropriate
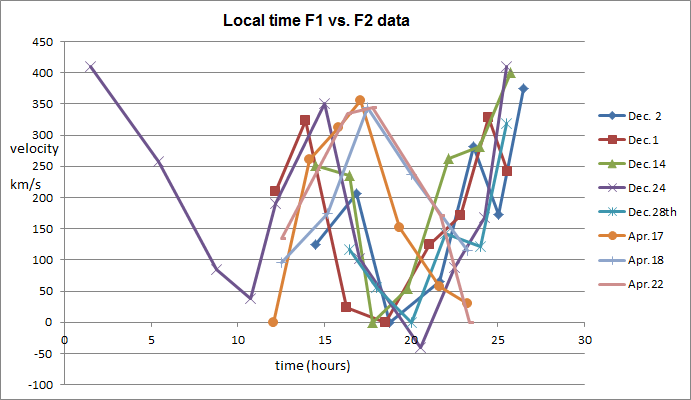
units of velocity compatible with Silvertooth’s original method. Data
was
collected every 1-3 hours over approximately 12 hours per session. The results of 8 sessions
performed between
Dec. 2011 and April 2012 are shown below in Fig. 11 and 12, normalized
as
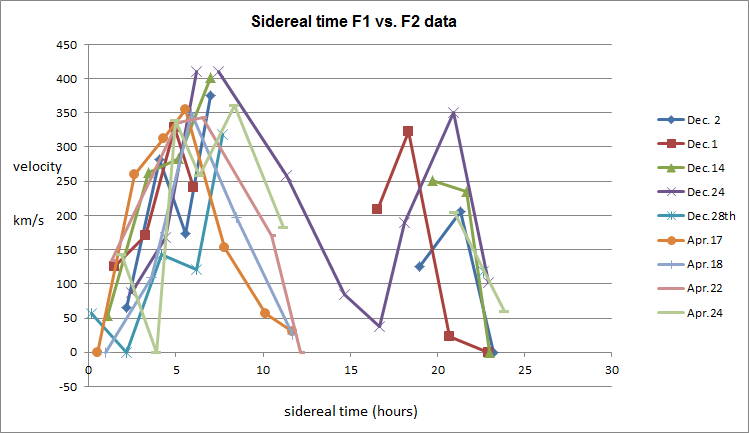
before. Fig.
11:
Apparent wavelength
difference F1 vs. F2 in sidereal time converted to a velocity
Fig.
12: Apparent
wavelength difference F1 vs. F2 in local time converted to a
velocity
The results are
displayed in sidereal time and local time. Similar to the observations
using
Silvertooth’s original method, the sidereal data again showed a peaking
of the
data around 5hrs and 17-22 hours sidereal time, and a trough around
11-12 hours
and 24 hours. This pattern was again somewhat characteristic of the
anticipated
“Silvertooth effect”. The local time data tended to show a peak around
15hrs
and just after midnight local time, with a trough at around 18-19 hours
local
time. The local time pattern resembled the pattern seen in Fig. 7.
Interestingly, it
was observed that in virtually all cases, the frequency of the
wave-train from
the SWD sensor was almost always less than the frequency of the PD
sensor on
the Michelson interferometer side, and this was the case for both peaks
observed in the diurnal pattern. This observation suggests that what is
being observed
is not the wavelength change expected by Silvertooth, since the F1
signal
should become higher in frequency than the F2 signal when Leo is on the
eastern
horizon (since the laser is pointing east). F1 was always lower in
frequency
(longer in wavelength) than F2 when Leo was on either the eastern or
western
horizon.
So at this point, I
had verified the following:
1) A
12 hour diurnal change in the apparent (presumed) wavelength difference
between
that measured at SWD and PD does exist
as was
claimed by Silvertooth.
2) This
change in apparent wavelength lines up with the sidereal directions as
claimed
by Silvertooth
3) If
one uses Silvertooth’s method of calculating velocity from the results,
after
normalizing for instrumental offsets, one gets a
velocity range that on average
approximates our expected motion with respect to the CMBr. What I found to
be incorrect are the following: 1) The difference
between the
wavelengths measured at the SWD and PD sensors is not usually zero when
the
device is perpendicular to our motion through space – a significant
offset
usually exists which needs to be corrected to arrive at Silvertooth’s
predicted
velocity. 2) There is a large
variability in the
wavelength difference at the same sidereal time from day to day. 3) The expectation
that the wavelength
measured at SWD would be smaller than that measured at PD when Leo was
on the
eastern horizon was not confirmed, instead, the opposite occurred. 4) The 12 hour
diurnal change also
occurs in local time so the sidereal correspondence is not unique.
In our next series
of tests, I sought to determine if the sidereal and/or cardinal
orientation of
the SWD sensor and the beam through it makes a difference to the
diurnally
measured result. Quoting Silvertooth from his 1986 paper: “The apparatus
is mounted on an optical table such that it
may be rotated about a vertical axis. When the line of travel D is oriented in
an east-west (EW)
direction at a time when the constellation Leo is on the horizon, D, as previously
defined, measures
0.25 mm. With the apparatus rotated 90o
(north-south) the outputs of
the detectors remain in phase during an excursion of D.” [3] The first issue
is that this observation is actually wrong
based on Silvertooth’s own theory.
When
Leo crosses the south cardinal direction it does so at an angle above
the
horizon of about 33 degrees in December from the latitude of Olga,
Washington.
When it crosses the north cardinal direction it does so at an angle of
around
48 degrees below the horizon. So
there
should always be some smaller velocity component of motion detectable
when the
device is pointed north or south, just lower than when pointed east and
west.
Further, this pattern of change in D should be 6
hours out of phase between the two orientations.
The latitude at Toronto is not much different that Olga, Washington, so
a
similar result would be expected here.
I
decided to test this idea by re-running the experiment but now changing
the
orientation of the SWD sensor from E-W to N-S as shown below, keeping
all else
the same. Fig.
13: SWD
sensor
moved from the E-W position to the N-S position.
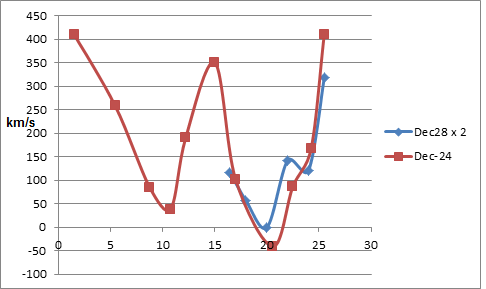
The result of
this experiment, from Dec. 28th,
2011, is shown below. Although the Dec. 28th
result was smaller as
expected (it is multiplied by 2 in the graph for comparison purposes),
it
remained in phase with the test of 4 days prior. This result suggested
that the
orientation of the SWD sensor in the beam path has no effect on the
resulting
determination of D,
which is at odds again with Silvertooth’s theory. Fig.
14:
Comparison of
E-W vs. N-S orientation of the SWD sensor
However, a
similar experiment was performed where the laser
was turned 90 degrees in the apparatus rather than the SWD sensor – in
this
test the pattern did shift by about 3 hours from the expected pattern
(data not
shown). This result suggested that it is the laser and not the other
components
in the optical system that may be responsible for the effect. Examining
the
HeNe laser
as the possible source of the “Silvertooth effect”.
Focus was now
placed on the HeNe laser as being potentially responsible for the
diurnal
pattern of apparent wavelength change observed in the experiment. It
had been
noticed in prior experiments that slight adjustments in the alignment
of the
mirrors during a reading session would skew the phase shift graph up or
down at
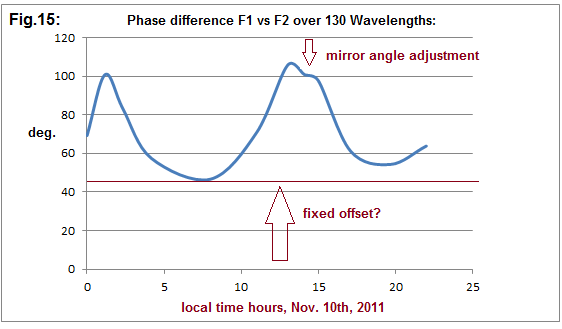
that reading. An example is shown below in Fig. 15.
This graph also
shows the uncorrected offset in wavelength
difference between the signals F1 and F2 measured at SWD and PD. It was
suspected that one major contributing factor to the apparent wavelength
difference measured at SWD vs. PD could be a misalignment of the beams
passing
through either sensor – if they were aligned at SWD and misaligned at
PD, then
moving the stage would lead to a path length difference between the
interfering
beams being made to interfere at the sensors. This path length
difference could
cause more or less interference peaks and troughs to pass through one
or the
other sensor, making it appear as if the wavelengths were different
when in
fact it is the path lengths of the individual interfering beams that
are
different. This is one of the criticisms made of the Silvertooth
experiment by
Chalmers Sherwin in 1989 – that it was prone to this kind of error. To
quote
Sherwin: “A slight
twisting, causing path differences of the order 1/4l of the assembly
being transported
(PD-D1 and M4) could cause the phase of one signal (the output of PC)
to appear
to reverse phase with the other signal (the output of D2).” [6] The problem with
this argument is that this twisting
misalignment would occur for all readings likely in a similar way – so
this may
account for some fixed errors (such as the fixed offset shown above)
but does
not account for the diurnal variation effect in and of itself, unless
it can be
demonstrated that this kind of misalignment is actually occurring
diurnally due
to some unknown factor(s). However, since the beam alignment change
appeared to
be able to mimic the apparent wavelength change, I turned my attention
to the
HeNe laser itself to determine if there was any reason to believe that
the beam
exiting the tube was not stable in its angle to the apparatus. I performed a long series
of experiments on
this using a four quadrant photodetector and data logger setup which is
fully
described in the companion paper to this article: A
Four Quadrant Photo Detector for Measuring Laser Pointing
Stability (2012) .
To
address this issue briefly, it was discovered that HeNe lasers do in
fact
exhibit significant drift in their beam exit angle that could affect
the
results of interferometer experiments such as this one. However, is
this beam
angle wandering a factor in Silvertooth’s experiment? Applying a 4
quadrant
photodetector into Silvertooth’s interferometer, such as putting it in
the
place of PD presents some problems, as is outlined in the example below
in Fig.
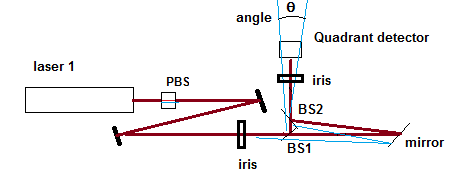
16. Let’s consider
this simplified
arrangement in which a HeNe laser beam is split into two beams at a
beam
splitter (BS1), one beam going directly to a 4 quadrant detector, the
other
going to a distant mirror and being reflect back to the quadrant
detector by a
second beam splitter (BS2). After following these different paths,
let’s assume
the two beams diverge at the detector by some variable angle q
due to the wandering of the HeNe laser exit angle. This is shown in
Fig. 16 by
the blue lines. Since there are two separate beams moving symmetrically
along
opposite quadrants as the angle changes, the net effect of their
progressive
divergence will be measured as close to zero, since they will cancel
out in the
X output while the SUM output will remain conserved. This is what
appears to
have happened when I actually performed this test using a 4 quadrant
detector,
as shown in Fig. 17 below. The X and Y drift were measured as flat over
10
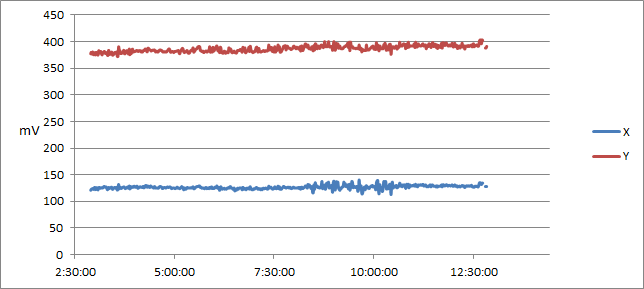
hours of observation. Fig.
16:
Fig.
17: No visible beam drift along X
or Y when PD is replaced by a quadrant photodiode.
However,
I worked out an alternative approach to measuring beam divergence at
the
detectors in Silvertooth’s experiment based on interference intensity.
The
intensity of the interference signal at each detector was routinely
seen to be
highly sensitive to how perfectly parallel the two intersecting beams
were. I
decided to use this observation to develop a way to monitor the beam
angle
changes at the detectors. This was done by adjusting the interference
signal at
each detector using the mirrors to a point where a slight change in the
mirror
angle would cause a large change in the interference amplitude at the
detector.
Then the AC signal generated at each detector by the moving actuator
was
rectified and displayed on voltmeters for monitoring over the course of
a given
session. This was applied to both the SWD and PD sensors, the results
are shown
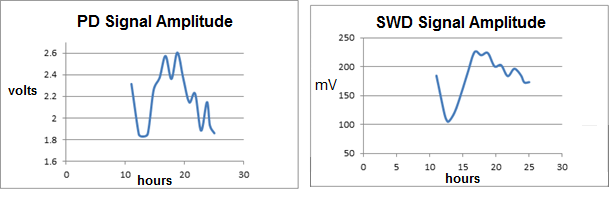
below. Fig.
18:
Observable change in
interference intensity over time at SWD or PD.
When performed
this way, the” Silvertooth effect” became
immediately visible, now as a amplitude change in the interference
signals at
each detector. In fact the effect was clearer at the Michelson detector
than at
the SWD detector – implying the SWD detector is in no way required for
measuring this diurnal change. The
“Silvertooth
effect”
as a diurnal change in the HeNe laser beam angle
At this point I was
still not clear on what the sidereal or local phenomenon responsible
for the
diurnal pattern seen in the interferometer really is. However, the
discovery
that this effect can now be seen in the interference intensity at a
single
detector made it possible to apply more sophisticated data logging
techniques
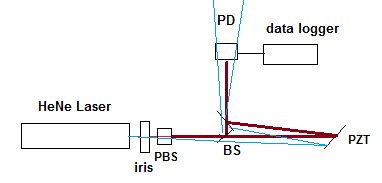
to understand what is going on. I returned to the simplified
interferometer
shown in Fig. 19 which had only one interference detector, and was
modified
slightly from the usual Michelson arrangement to the one shown in the
diagram,
with the purpose of preventing any beam components from travelling back
towards
the laser where they might destabilize it.
A data logger was used to collect
measurements of
the interference
intensity at the PD sensor over the course of 12 days during the
November and
December, 2012. As before, an AC signal was generated at the
photodetector using
the piezo actuator (PZT) to move one beam past the other. This signal
was
converted to DC using a rectifier circuit, which then was read by an
A/D
converter in our PIC16F777 data acquisition system. Thereby a sampling
of the interference
intensity was made once per second, and averaged each minute in the
data logger
before being sent in real time to an Excel spreadsheet for analysis and
graphing. This data is shown in Fig. 20 below, and is based on over one
million
measurements averaged to approximately 17,000 data points. Fig.
19:
Interferometer
for measuring HeNe laser drift at the PD detector.
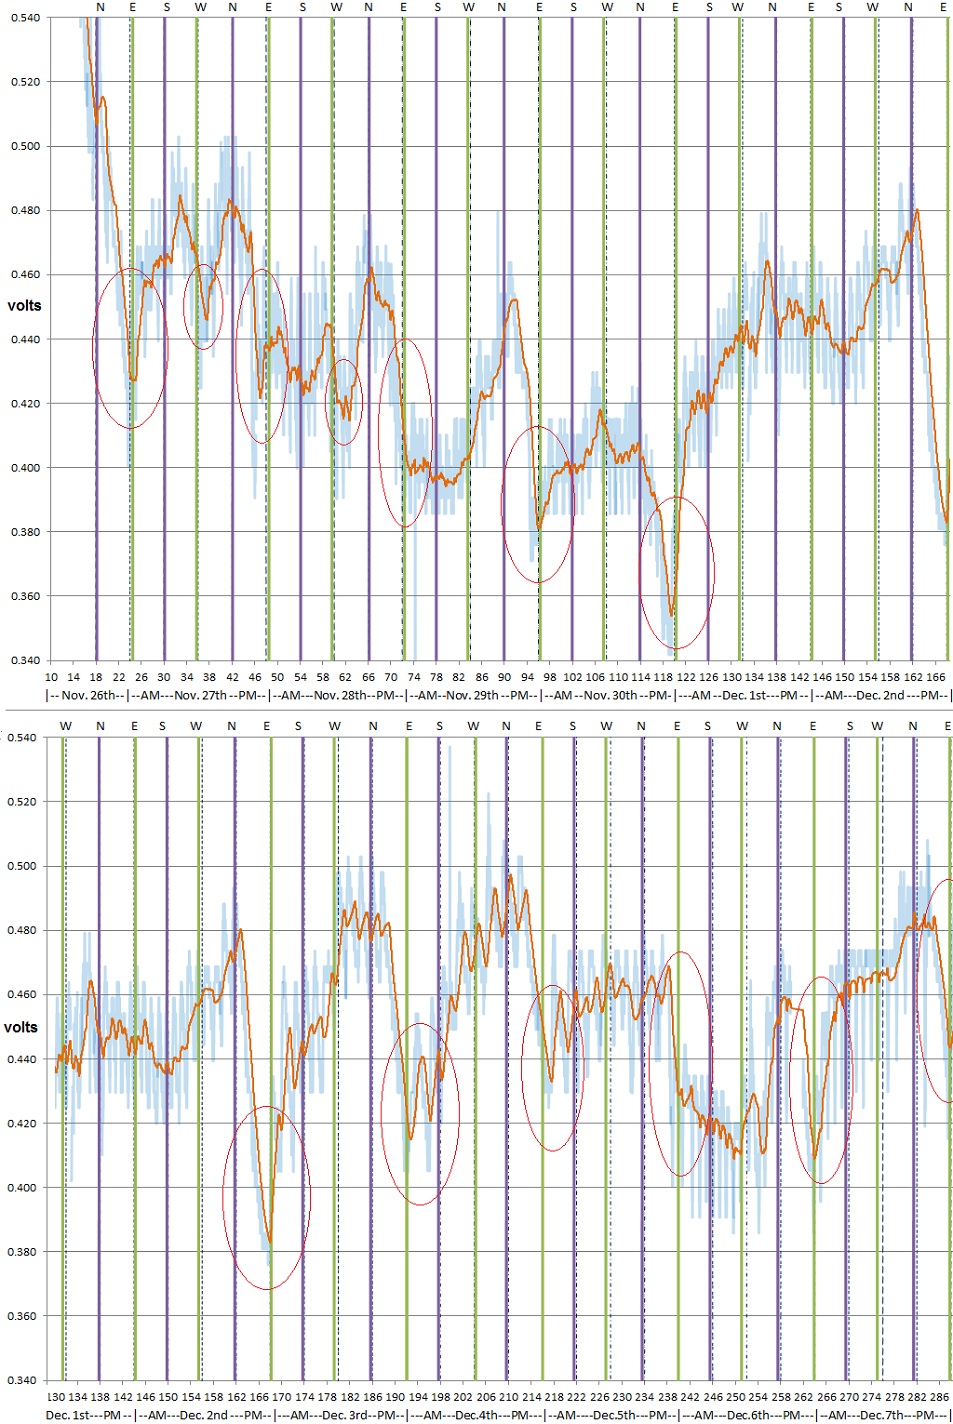
The amplitude
(in volts) of the interference signal is on the
Y axis, and the local time (in days, 2012) is on the X – axis bottom.
The green
and purple lines mark the local time when Leo crosses a particular
cardinal
direction in the sky. Green is for E or W, purple is for N or S. The
raw data
is shown in light blue – it was very noisy so a 90 minute moving
average of the
data is also shown in orange. It became immediately evident as this
data was
collected in real time that room temperature was playing a big role in
the
fluctuations seen in the interference intensity – the spikes seen in
the data,
occurring every 50-70 minutes, are in fact due to the furnace cycles
heating
the room (forced air gas). Although these only caused the room
temperature to
change by perhaps 2-3 degrees Celsius per cycle, this caused a
significant
swing in the interference intensity. Interestingly, troughs in
interference
intensity tended to occur each day coincident with Leo passing over the
eastern
horizon. These events are circled. In two cases this also happened when
Leo
crossed the western horizon (also circled). Fig.
20: Diurnal
change
in interference intensity due to HeNe laser beam drift.
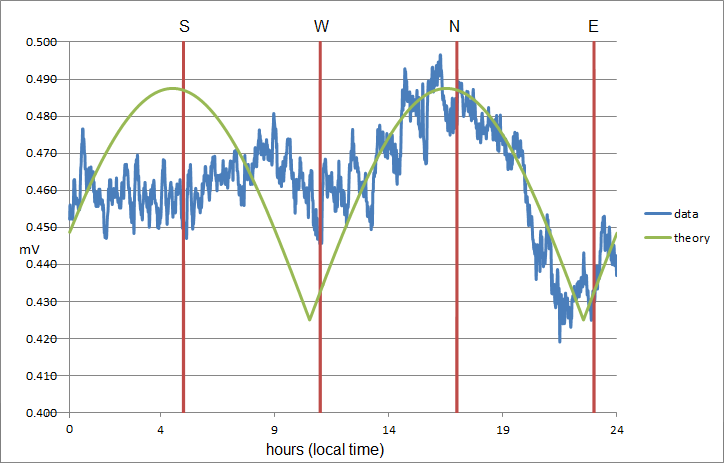
On the very
first day, the expected 12 hour two peak pattern
of Silvertooth was observed – this then evolved into a pseudo 12 hour –
24 hour
pattern. An average was made of the pattern over the first four days,
as shown
in Fig. 21. If one applies the anticipated “Silvertooth effect” pattern
of Fig.
1 loosely to this diagram, we find at least a partial correspondence.
If Fig.
21 is plotted in sidereal time (not shown), then the best
correspondence likely
occurs if one is the inverse of the other. The place where Leo crosses
a
cardinal direction in marked in red. Fig. 21: Four day
average derived from Fig. 20.
To further
elucidate the cause of this effect, I then
monitored the interference intensity vs. the drift in the lock voltage
on the same
frequency-stabilized laser, as shown below in Fig. 22. As was reported
in our
companion article on the four quadrant photodetector, the laser lock
voltage
appears to drift somewhat over the course of hours and days due to
temperature
pressure in the room. From Fig. 22 we can see that both the lock drift
and the
interference intensity follow the same pattern of change over 48 hours,
including both showing the repeated swings in room temperature caused
by the
forced air gas heating of the room. Therefore the two effects must be
linked –
in fact, since the laser lock voltage drift appears to proceed the
interference
intensity drift by a few minutes, it would appear that it is the
movement of
the laser mode along its gain curve that is driving the beam angle
drift.
Having arrived
at this understanding, I then sought to answer
two further questions:
Question 1:
Does the beam drift on the current laser under test correspond to the
lock
voltage drift on a separate laser pointing in the
perpendicular direction?
Question 2: Can
the diurnal pattern be accounted for entirely from room temperature
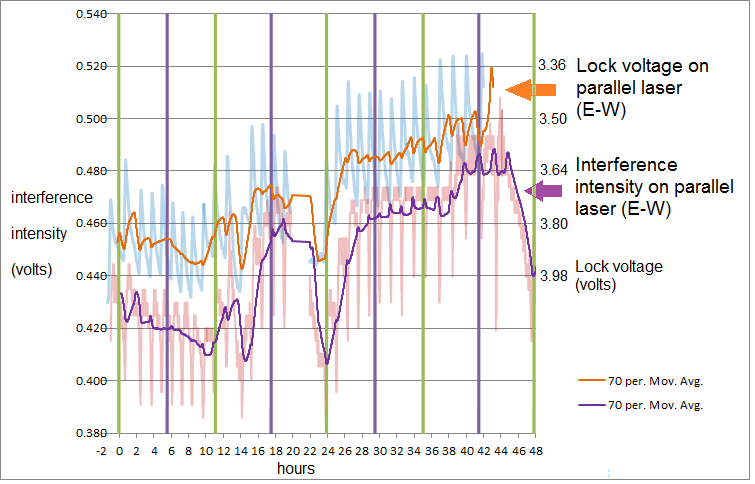
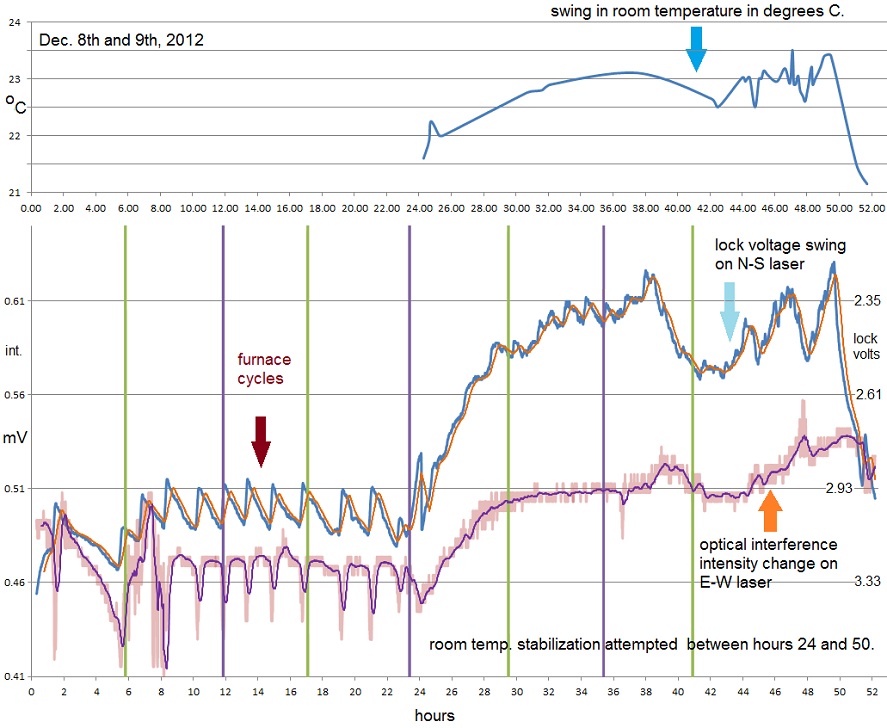
changes? The following
experiment was then performed on Dec. 8th
– 9th, 2012. One laser was used to drive the
interferometer of Fig.
19, and the other laser was also turned on but pointed at 90 degrees to
the
first (pointing N-S). With this second laser, I simply monitored the
lock
voltage drift over time. Simultaneously, I monitored the room
temperature
(starting Dec. 9th).
All of
this is shown below in Fig. 23. Over the course of Dec. 8th
the room
temperature was allowed to vary as usual. Starting at midnight and
through Dec.
9th an electric heater was added with tighter
temperature control to
attempt to regulate the room temperature near the lasers. As can be
seen from
the graph, the forced air gas cycles were abolished by the electric
heater
intervention, with the room temperature slowly rising. Towards the
latter part
of Dec. 9th turbulent weather outside disrupted
the temperature
control, causing some temperature fluctuations, but these were closely
paralleled by both the laser pointing E-W (in interference intensity)
and the
laser pointing N-S (in lock voltage drift). Fig. 23: Effect of regulating room temperature on the interference intensity.
The electric
heater was turned off
at hour 50, which led to a steep fall in the room temperature. Both
lasers
responded by a similar fall in their readings.
This close correspondence between the
laser
interference pattern, lock
voltage and temperature was strong evidence that diurnal temperature
changes
are the sole source of the “Silvertooth effect.” The fact that the
laser
pointing E-W and the Laser pointing N-S showed the exact same pattern
of change
indicates that the direction the apparatus is pointing has nothing to
do with
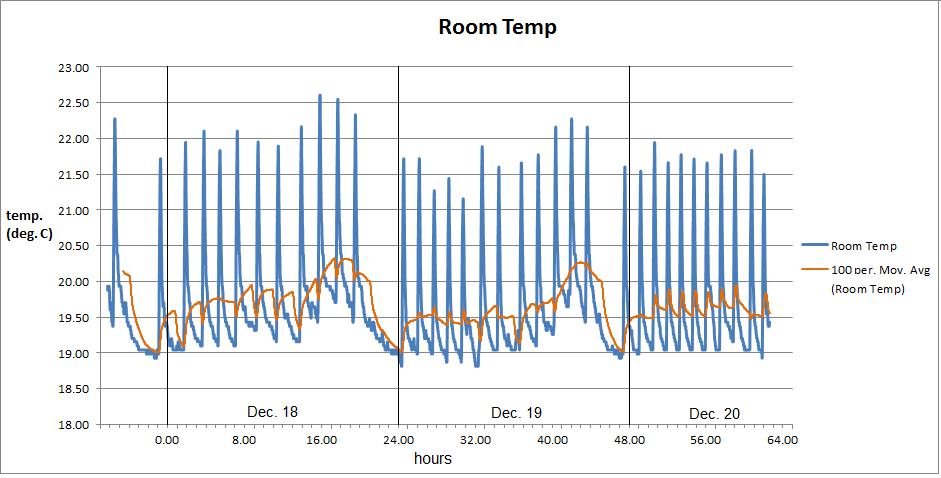
the effect observed. I
then monitored
the room temperature for a further 3 more days allowing the temperature
fluctuations to occur normally, using automatic data logging. As can be
seen
from the graph below (Fig. 24), the diurnal pattern of change
characterized in
Fig. 21 can be clearly seen in the moving average, including the
consistent
drop near midnight each night which corresponds to the crossing of Leo
on the
eastern horizon (hour 0, 24 and 48 corresponds to midnight each night
in this
graph). The temperature curve suggests that this is due to a slowing of
the
furnace cycling in early evening, along with the outside temperature
drop at
dusk. It is a remarkable coincidence that this temperature drop occurs
precisely when the constellation Leo is on the eastern horizon. Fig.
24:
Spontaneous room temperature fluctuations monitored over 3 days
in Dec., 2012
Returning to the “Silvertooth effect” pattern observed in Fig. 7, it’s now obvious this pattern is nothing other than the inverse of the room temperature pattern of Fig. 24. Fig. 7 is shown again below for reference. The trough at around 18:00 hours is in fact the inverted daytime thermal peak due to the action of the sun, and the peaks at around noon and midnight appear to be due to the lower room temperatures in the morning and late evening, again inverted.The curve is inverted likely because the primary effect of rising room temperature on the laser is to bring the two interfering beams closer to parallel in Silvertooth’s interferometer.
Discussion
and
conclusions:
After
considerable study as detailed in this report, the
“Silvertooth effect” as I have called it can now be fully explained.
The
diurnal change in room temperature, due largely to a combination of the
heating/cooling cycles of the sun and routine human activity, cause
slight
changes in the beam exit angle from a HeNe laser tube. This in turn
changes the
length of the beam paths in the optical circuit, and ultimately the
angle at
which the beams intersect in interference at the photo-detectors SWD
and PD.
The net result is that when the stage is moved along these intersecting
paths,
the number of wave peaks and troughs counted at the detectors will
differ in
proportion to the temperature induced change in the beam angles. Thus
the
result of this experiment is not evidence of any directionally
dependent
difference in wavelength – it is in fact only a very elaborate
thermometer! In
Silvertooth’s own experiments this temperature effect was likely more
dramatic
since his laser was not frequency-stabilized. This revelation is
undoubtedly a
deep disappointment to many who held on to the notion that this
experiment
might represent elusive evidence of an optically detectable ether.
Although I
personally recognized that this experiment should in theory not work, I
had
hoped that perhaps Silvertooth had stumbled upon some fluke for
breaking the so
called “conspiracy of light.” My own persistence with this experiment
was
because of the uncanny correlation of the diurnal pattern in the data
with the
alignment of the interferometer along our direction of motion through
space,
which now appears to be simply a bizarre coincidence.
This result is
consistent with the findings of our previous standing wave
interferometer experiment
A
Single Laser One-Way
Speed of Light Experiment using a Standing Wave Interferometer (2011). In that paper
the null result was explained on the basis that
according to Lorentz’s exact theorem of corresponding states (1904) the
effects
of time dilation acting on the laser source and the Lorentz contraction
on both
the source and the optical paths will serve to insure that the
interference
positions of light and darkness will be conserved during the rotation
of the
apparatus, even if a preferred frame of reference for light exists.
This also
holds true for any attempt to measure the wavelength of light along any
given
path – if the positions of light and darkness are always conserved,
then the
apparent wavelength along any path must always be measured to be the
same
regardless of direction. Similar to the proposition of Tyapkin’s "On
the Impossibility of
the First-Order Relativity Test", a one way
wavelength of light test is just as
impossible to perform as a one-way speed of light test. Interestingly,
Silvertooth was aware of this paper by Typakin and even quoted it in
his first and
third paper, and yet ignored its relevance to his own work. The relativistic proposition
is of course neither
confirmed nor denied by this exercise, since both special relativity
and
Lorentz ether theory (1904) would similarly call for a null result in
this
experiment. This outcome reinforces the necessity of a philosophy
towards
science where initially positive results should be subjected to
continued and
rigorous scrutiny, in the spirit of Popper. Silvertooth’s experiment is
clearly
a case where even when the experiment obeys your prediction, this does
not
necessarily mean that the theory is true, particularly if all possible
scenarios that could prove your theory false have not been ruled out. References:
1 ) Muller, “The Cosmic
Background Radiation and
the New Aether Drift.”
2 ) E.W.
Silvertooth, S.F. Jacobs (1983) Applied Optics Vol. 22 No. 9, p.
1274-5.
3 ) E.W.
Silvertooth, “Experimental
Detection of the Ether” (1986) Spec.
Sci Tech. Vol.10 No.1
p.3-11.
4 ) E.W.
Silvertooth, “Motion Through the Ether.” (1989) Electronics and
Wireless World.
5 ) E.W.
Silvertooth, C.K. Whitney, (1992) “A New Michelson-Morley Experiment.”
Physics
Essays Vol. 5 No. 1 1992 P. 82 -89.
6 )
Chalmers
W. Sherwin, (1989) “An Analysis of the Silvertooth Experiment.” Physics
Essays
Vol. 2 No. 2 P. 125 – 127.
7 ) Tyapkin,
A.A., (1973) "On
the Impossibility of
the First-Order Relativity Test." Lettere Al
Nuovo Cimento Vo. 7, No. 15, 760-764.
8 ) Doug
Marett : “A
Four Quadrant Photo Detector for
Measuring Laser Pointing Stability (2012)” www.conspiracyoflight.com. 9 ) Doug Marett : “A Single Laser One-Way Speed of Light Experiment using a Standing Wave Interferometer (2011).” |