|
A four quadrant
photo
detector for measuring laser pointing stability
Doug Marett (2012)
(about the author)
pdf version here
Note: An
upgraded version of the quadrant detector described herein is now
available at our online
store.
Introduction
Beam pointing
stability is an important quality of a laser.
Angular drift in a laser beam can be a serious concern in
interferometer
experiments where such drift can cause anomalous fringe shifts, skewing
results. We describe herein a 4 quadrant photo detector we constructed
for
measuring angular beam drift in a HeNe laser system. We then examine
the degree
to which the exit angle of a couple of HeNe laser tubes drift over the
course
of hours to days, and what are the underlying causes of this drift.
The 4 Quadrant
Photodiode Principle of Operation:
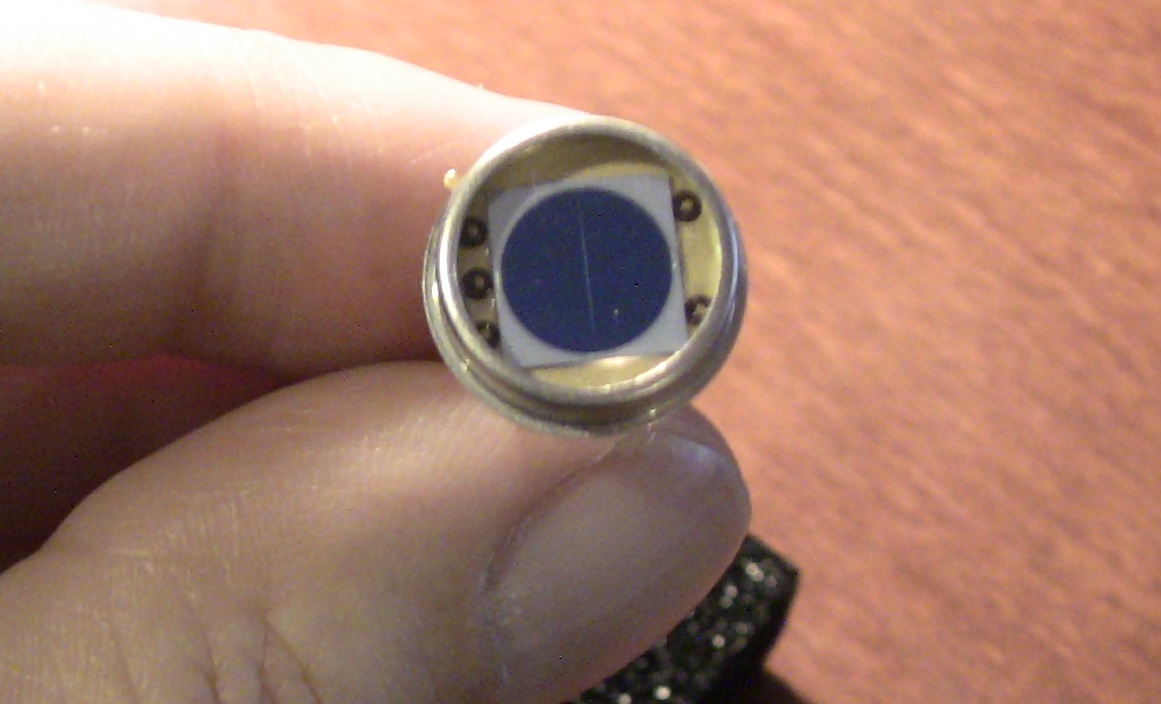
The photodiode unit
consists of 4 separate P on N silicon photosensitive surfaces separated
by a
small gap, as shown in Fig. 1. In our device this gap is 42 um.
The laser beam is usually pointed towards the
dead center between the 4 quadrants and the beam diameter is selected
to fit
inside of the total quadrant area. Although light falls on all four
quadrants,
the difference between the left and right quadrants (X output) and top
and
bottom quadrants (Y output) can be adjusted to zero by centering the
beam,
whereas the SUM is at a maximum. The device X and Y output voltages
thereby
become very sensitive to slight deviations in the position of the beam
from
this initial centered setting. The SUM value on the other hand can be
used to
measure changes in the beam intensity, so this can be used to correct
the X and
Y output values for voltage changes that are due to intensity
fluctuations
rather than actual beam deviations.
Fig. 1:
A 4-Quadrant Photo detector from First Sensor
(formerly Pacific Silicon) QP50-6-TO8
In order to
present the outputs of the 4 quadrants as X, Y
and SUM, it is necessary to first amplify the individual quadrant
outputs, and
then combine them using a series of sum and difference amplifiers (for
X and Y)
or just a sum amplifier (for the SUM output). The circuit we chose is
shown
below: Fig. 2A:
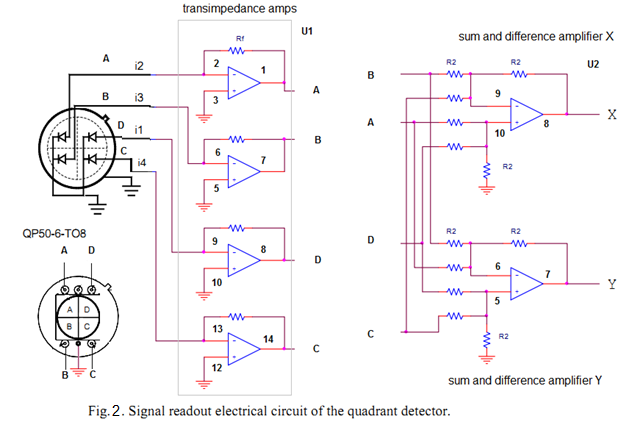
Rf
= 10K, all others = 20K. The op-amps
used were the TLC2264 quad type at +/-5VDC operating voltage. The X and
Y
amplifiers are shown above and connect to the outputs of the
transimpedance
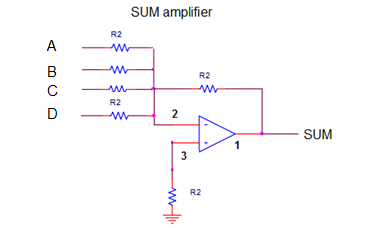
amplifiers. The SUM amplifier is shown below and also connects to the
outputs
of the transimpedance amplifiers (A,B,C,D). Fig. 2B:
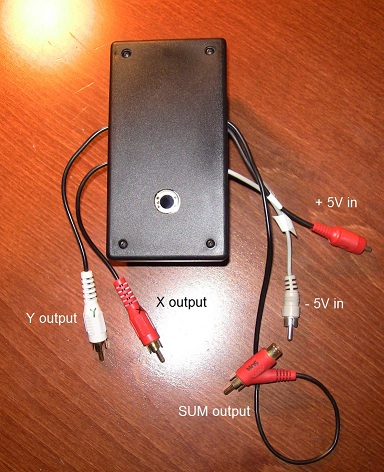
The circuit was
assembled and put into a project box as shown
in Fig. 3. The back of the box was fitted with threaded screw holes to
allow
mounting on a Thorlabs KM100B kinematic mount.
Fig. 3: The
completed
4–Quadrant Photodetector showing the amplifier output leads
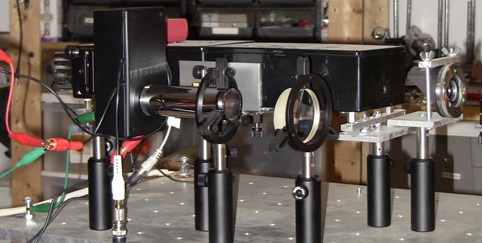
Once completed,
the device was screwed onto its kinematic
mount and placed on an optical breadboard as shown in Fig. 4. A metal
shroud
was mounted in front of the detector window in order to shield it from
the room
lights. A lens was also used to focus the laser beam from the HeNe
source to a
suitable size to fit inside of the quadrant area.
Fig. 4: Close-up
of the
detector on the optical breadboard.
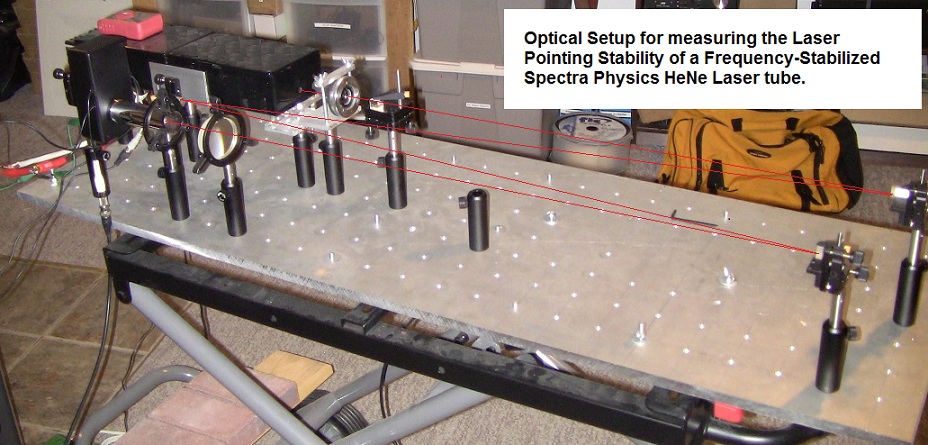
In order to make
the drift angle as obvious as possible, the
path length from the laser to the quadrant photodiode was made around
2.5
meters long by bouncing the beam between a series of mirrors. This is
shown
below in Fig. 5. A polarizing beam splitter was used at the beginning
to select
out a single polarization of the beam for study.
Fig. 5:
Finally, a 3
channel voltage data logger was used to sample
the photodiode outputs every minute and to send these data samples
directly to
an Excel spreadsheet for later plotting. This data logger is similar to
the one
described in the article here. Briefly, it
uses a PIC16F777
microcontroller and three A/D channels to collect the X, Y, and SUM
data, which
are converted to ASCII voltage values and sent directly to an Excel
spreadsheet
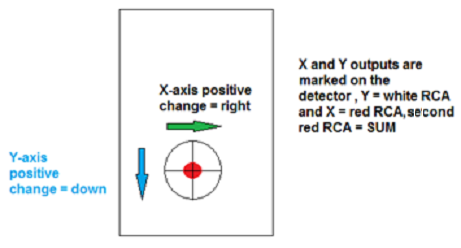
using the Parallax freeware program PLX-DAQ. The convention for the
drift
direction and the polarity of the data output is shown below:
Fig. 6: Arrows
show how
to interpret the X and Y voltages as a beam drift direction.
Part 2:
Measuring Actual Beam Drift in HeNe Laser Tubes
Before presenting
the data collected using the quadrant detector, let’s first establish
some
conventions about how these specific lasers operate. We are using two
custom
built HeNe lasers that are frequency-stabilized using a heating coil
wrapped
around the laser tubes that is controlled based on the intensities of
the two
modes in the waste beam. The lasers are described in detail here. In brief, the
lasers are interfaced
to an electronic circuit which attempts to lock the position of the two
laser
modes, one vertical and one horizontal, at some position along their
gain
curve. The laser circuit is controlled by a potentiometer which can be
adjusted
to increase or decrease the amount of heat applied to the tube, and
thereby
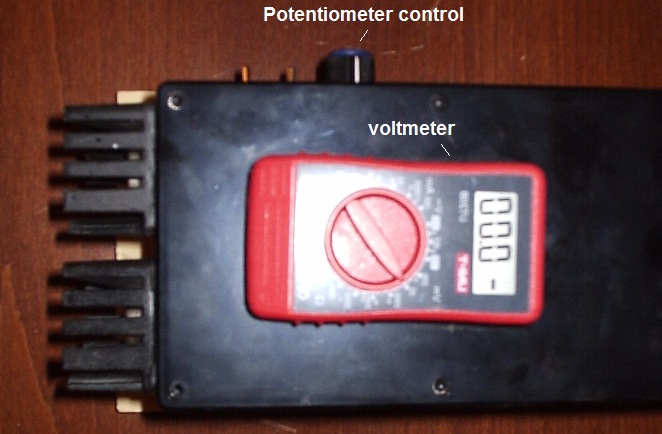
move the modes up and down the gain curve. This process is monitored on
a
voltmeter mounted on the laser enclosure that can be adjusted using the
potentiometer from +5VDC to -5VDC. At +5VDC, the vertical polarization
mode is
at the center of the gain curve (maximum output), and the horizontal
mode is
pushed to the far side (minimum output). At -5VDC the situation is
reversed –
the horizontal mode is near the center of the gain curve and the
vertical mode
is pushed to the side. This operation can be shown graphically below: Fig.7:
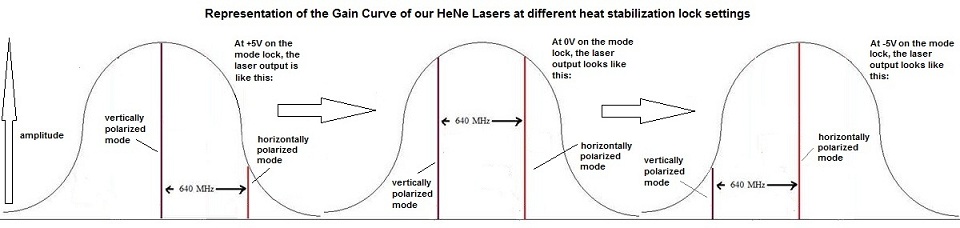
Fig.
8: Picture of the laser potentiometer
control and the voltmeter on the enclosure.
Example Drift
Data from the Frequency Stabilized Spectra Physics HeNe
Tubes
Some data examples
are shown below for two different Spectra Physics HeNe tubes (herein
referred
to as 1 & 2) – both lasers exhibited similar deviations of the
X and Y axis
alignment over the first 12 hours after cold start-up. Lasers were
turned on at
9 and 10 AM respectively, allowed 90–120 minutes to warm up, put on
mode lock,
and then the drift measurements were initiated. In both cases
horizontally
polarized laser light alone was measured at the detector and the lasers
were
locked with the horizontal mode at less than the amplitude of the
vertical mode
at ~+1v setting on the lock voltage - see description above.
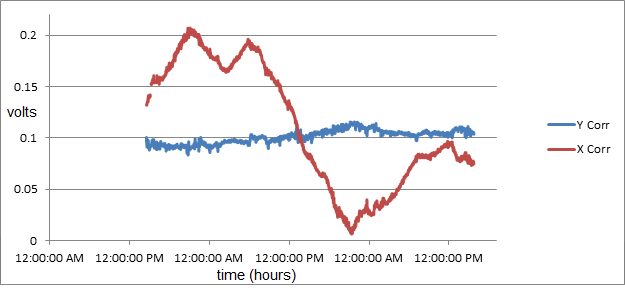
Fig. 9: Drift of
the
horizontal mode from HeNe Laser 1 and 2 over 14 hours:
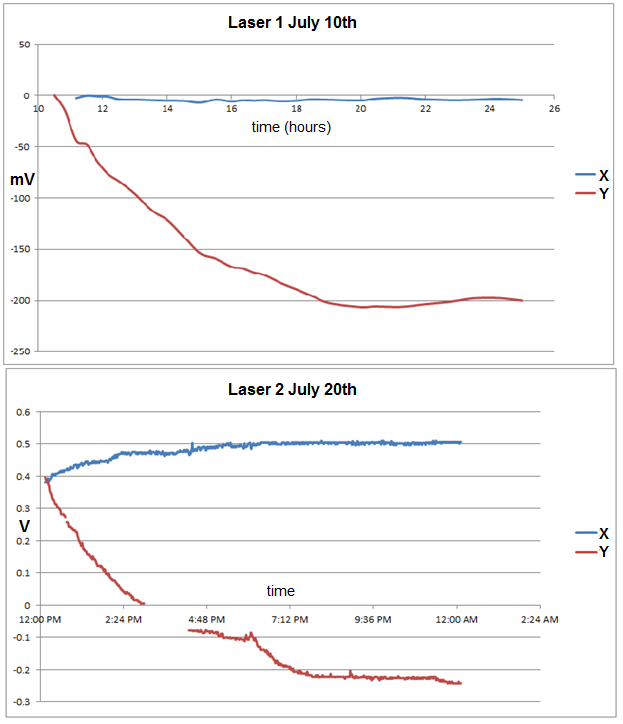
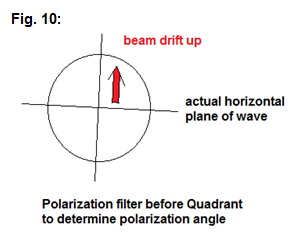
To determine the
polarization sense and angle, a polarization
filter was placed in the path to the quadrant detector and adjusted
until the
SUM went to zero. This showed that
in
the case of laser 2, for example, the horizontally polarized beam was
slightly
off the exactly parallel to earth horizontal. The beam drift appeared
to be predominantly
vertical and normal to the plane of polarization – however, due to this
slight
misalignment to earth horizontal, the data for laser 2 also showed a
drift
slightly to the right (X-axis positive drift) and predominantly up
(Y-axis
negative drift) as can be seen in the lower part of Fig. 9. This is
shown
diagrammatically below.
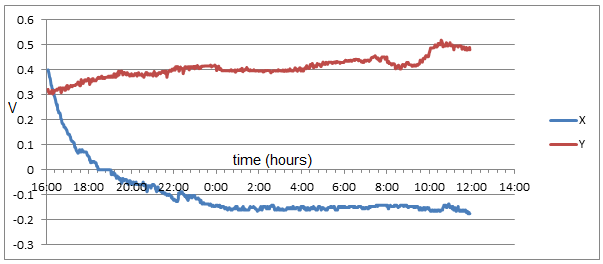
This process
appeared to be a long term stabilization pattern
for these Spectra Physics HeNe tubes which usually stretched over 8
hours or
more. This often ended in a lessening of the drift, but in some cases
then
developed into more chaotic patterns of smaller amplitude. When the
vertical
polarization mode was selected instead, the pattern of X and Y change
was
reversed. This is shown below in Fig. 11. Again, most of the drift
occurs in
the first 8-10 hours after starting up the laser. Lock voltage was
~+1v.
Fig. 11: Drift
of the vertical
mode from HeNe laser 2 following cold start-up over 20 hours.
The vertical
mode of the beam appeared to drift normal to its
plane of polarization as shown below, which was off slightly from the
earth
vertical and predominantly to the left:
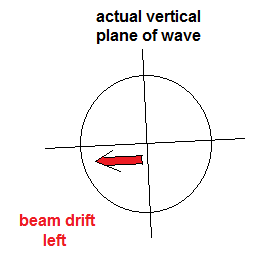
Fig 11B: Temperature-related drift
in the beam angle.
It was observed
on at least one occasion that long after the
initial warm up stabilization period of 10 hours, smaller amplitude
drift
patterns would emerge such as shown below in Fig. 12.
Fig. 12: Small
amplitude drift after initial stabilization of the tube.
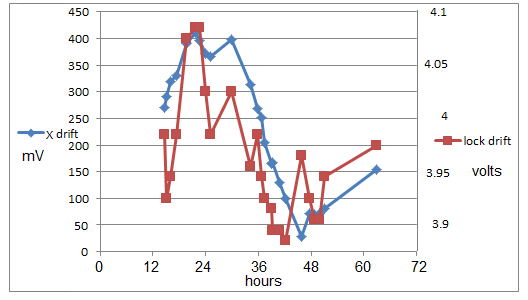
It was observed
that this drift followed a similar pattern to
the spontaneous drift of the mode lock voltage on the laser, as is
shown in
Fig. 13 below. This was after correcting for intensity changes by
normalizing
to the SUM values of each reading. Since the mode lock voltage is a
composite
of the combined waste beam intensities of the two modes, if the mode
lock
voltage is drifting then this means that the modes are also drifting
along the
laser gain curve, and it is this change which appears to be causing the
laser
beam to change its output angle by a small degree.
Fig. 13:
Comparison of
long term X-axis beam angle drift to laser lock voltage drift.
The ultimate
cause appears to be long term changes in room
temperature affecting the length of the HeNe tube. Although the HeNe
laser
tubes are temperature stabilized, this stabilization is floating with
respect
to the ambient temperature in the room, and any significant change in
room
temperature then puts pressure on the stabilization system to move to a
new
lock level, which subsequently leads to a new position of the two modes
along
the gain curve of the laser. This move along the gain curve then
results in a
change in the exit angle of the beam, which is detected in our
4-quadrant
photodetector data. In order to attempt to prove that the movement of
the modes
along the gain curve actually affects the beam output angle, we
initiated a
series of tests using a 4 channel data logger to monitor the changes in
the X,
Y and Sum values on the quadrant detector, concurrently with changes in
the
lock voltage. Sampling was performed 35 times per second on each
channel. In these tests the laser
LOCK switch was left off, and
the laser was started from cold and the modes were allowed to drift
back and
forth along the gain curve, which they normally do in the first hour or
more
after cold start. This is shown below in Fig. 14. The freely swinging
voltage
on the voltmeter is displayed in green, showing the swing of the modes.
The
blue data is the drift along the X-axis (after correcting for the
intensity
changes using the Sum values) and the red data is the drift along the
Y-axis
after applying a similar correction. The resultant data appears to
imply that
the laser beam is in fact drifting repeatedly in both the X and Y
directions as
the modes sweep along the laser gain curve, the greatest change
occurring for
the horizontal mode when it is farthest from the center of the gain
curve. This
is seen as spikes down from the blue and red lines in Fig. 14 that line
up with
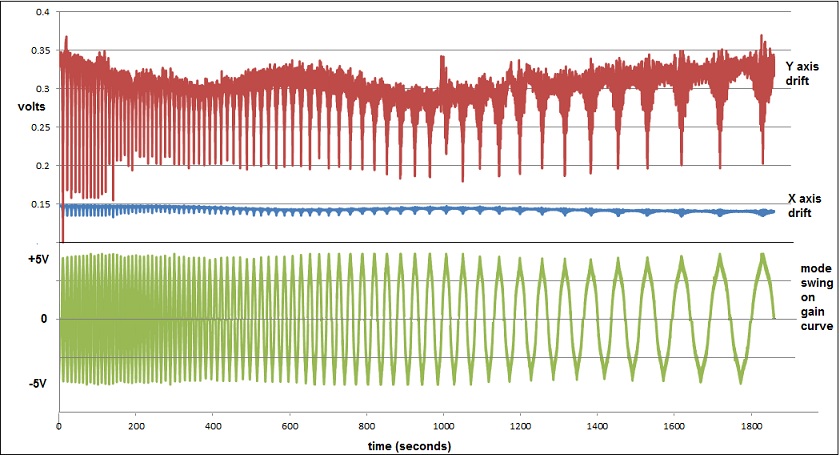
+5V on the voltmeter. A similar pattern is seen when the sampling is
longer as
shown in Fig. 15 – the beam pointing oscillation is then modulated by a
longer
range drift pattern, possibly due to room temperature changes.
Fig. 14:
Apparent
oscillation of beam position in X and Y due to mode cycling (5 minute
sample):
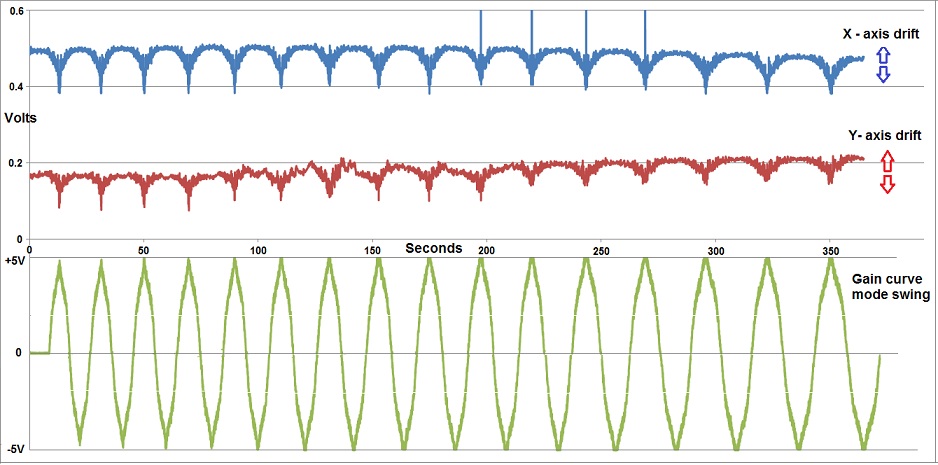
Fig. 15: Same
oscillation of beam position, now over 35 minutes:
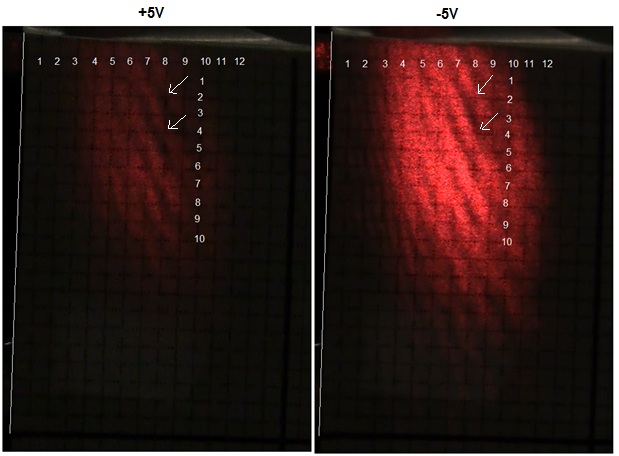
To further
verify that mode cycling actually causes the beam to
oscillate in its output angle slightly, a final experiment was
performed to
attempt to capture this phenomenon on video. Shown below is an excerpt
from
this video showing the HeNe laser beam (horizontal polarization)
projected onto
a screen after following a 2.5 m path with a number of mirror
reflections. Due
to the multiple reflections along the path, the beam is quite expanded
and has
some static interference lines in it which can be used as a reference
for the
movement of the beam during mode cycling. As can be seen from the
figure below,
at +5V on the voltmeter (left hand image), the horizontal mode is
weakest and
it is at the side of the gain curve, so the beam intensity is low. At
-5V
(right hand image) it is strongest in intensity due to it being near
the center
of the gain curve. By examining the interference intensity at the
arrows in
(left vs. right) it is clear that
the
interference lines have moved from one state to the other by around ¾
of a
fringe – in the video, this shift occurs once per mode cycle.
Fig. 16 –
Excerpt from
video showing beam drift during mode cycling.
So all of this
evidence (Fig. 13 – 16) seems to support the
idea that as our HeNe laser modes travel along their gain curve, that
the
output beam angle also changes slightly. The video evidence would
suggest that
the beam drift is on the order of a fraction of a mm at 2.5 meters from
the
laser tube.
Summation
We have sought in
this article to describe the construction of a 4 quadrant photodetector
circuit
and apply it to examining the patterns of beam angle drift in two
frequency-stabilized HeNe lasers that we had on hand. Surprisingly, the
lasers
do drift noticeably as readily detected in the changes in the X and Y
axis
voltages on the detector. The primary source of the drift appears to be
a
mechanical relationship of the beam angle with the position of the
laser modes
along the laser gain curve. As the modes move along the gain curve,
generally
due to a change in temperature and thereby a change in the length
and/or shape
of the laser tube, each mode component of the beam drifts in its exit
angle.
The amount of drift and direction is somewhat variable and depends on
the
conditions under test, but is generally on the order of a fraction of a
mm at
2.5 meters out from the laser for a full mode sweep along the gain
curve.
Further, the amount of angle change of the exiting mode component of
the beam
appears to be highest when the mode is at one or the other far side of
the gain
curve. Applying frequency stabilization to the laser by using a heating
coil
wrapped around the tube appears to only dampen this drift, and this is
likely
because the temperature control of the tube is floating with respect to
room
temperature. A proposed remedy for stabilizing the beam angle would
thereby be
to further enclose the lasers inside of a second enclosure that
regulates the
air temperature to a very narrow range. Combined with the primary
stabilization
heating coil, this method should insure that the laser maintains a
constant
beam angle at all times and that the laser lock voltage remains fixed
to its
original set value.
*******************************************
About the
Author:
Doug
Marett is a research scientist who has been working in industry
for the last 25 years. After receiving his M.Sc. from the University of
Toronto, his focus has been primarily in the design and development of
new technologies and products. This has included patented inventions in
the biotechnology sector such as novel medical devices, and more
recently product development in the field of optics and rapid
prototyping. He has been involved in a diverse range of projects
including NMR spectroscopy, inertial navigation and optical
interferometry. Being an experimentalist first and a theoretician
second,
Doug Marett adheres to the philosophy that experimental research should
drive theory development and its validation, not the other way around.
Doug
Marett working on a Helmholtz coil experiment, 2015.
|
|
|